plot#
- DataXY.plot(ax=None, fname=None, xlabel='__auto__', ylabel='__auto__', title='__auto__', logscale_x=False, logscale_y=False, xlim=None, ylim=None, plot_fmt=None, savefig_kwargs={}, **plot_kwargs)[source]#
Plot the data using
matplotlib.axes.Axes.plot().Note
DataXY.plot_kwargswill also be passed toplot().- Parameters:
- ax
matplotlib.axes.Axes, optional If a matplotilb axes is passed, plot data into it, else create a new axes.
- fname
str, optional If provided, the plot will be saved to this file using
matplotlib.figure.Figure.savefig().- xlabel
str, default “__auto__” Label for the x-axis.
If “__auto__”, use
DataXY.xlabel.- ylabel
str, default “__auto__” Label for the y-axis.
If “__auto__”, use
DataXY.ylabel.- title
str, default “__auto__” Title of the plot.
If “__auto__”, use
DataXY.title.- logscale_xbool, default
False If True, use a logarithmic x scale.
- logscale_ybool, default
False If True, use a logarithmic y scale.
- xlim
tuple[float|None,float|None], optional Limits for the x-axis.
- ylim
tuple[float|None,float|None], optional Limits for the y-axis.
- plot_fmt
str, optional format string for
plot().- savefig_kwargs
dict, optional Dictionary of keyword arguments passed to
savefig().
- ax
- Returns:
tupleofmatplotlib.figure.Figure,matplotlib.axes.AxesA tuple containing the matplotlib Figure and Axes.
- Other Parameters:
- plot_kwargs
dict, optional Additional keyword arguments are merged with
DataXY.plot_kwargsand passed tomatplotlib.pyplot.plot.
- plot_kwargs
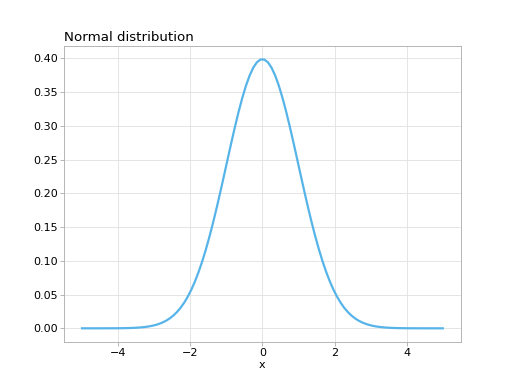
Examples
import matplotlib.pyplot as plt
import numpy as np

import atompy as ap

plt.style.use("atom")

data = ap.DataXY.from_function(
    ap.gauss, np.linspace(-5, 5, 100), title="Normal distribution", xlabel="x"
)

data.plot()
(
Source code,png,hires.png,pdf)