atompy.Hist1d.within_range#
- Hist1d.within_range(range_, keepdims=False)[source]#
Return a
Hist1donly within range_[0] and range_[1].- Parameters:
- Returns:
- hist1d
Hist1d
- hist1d
Examples
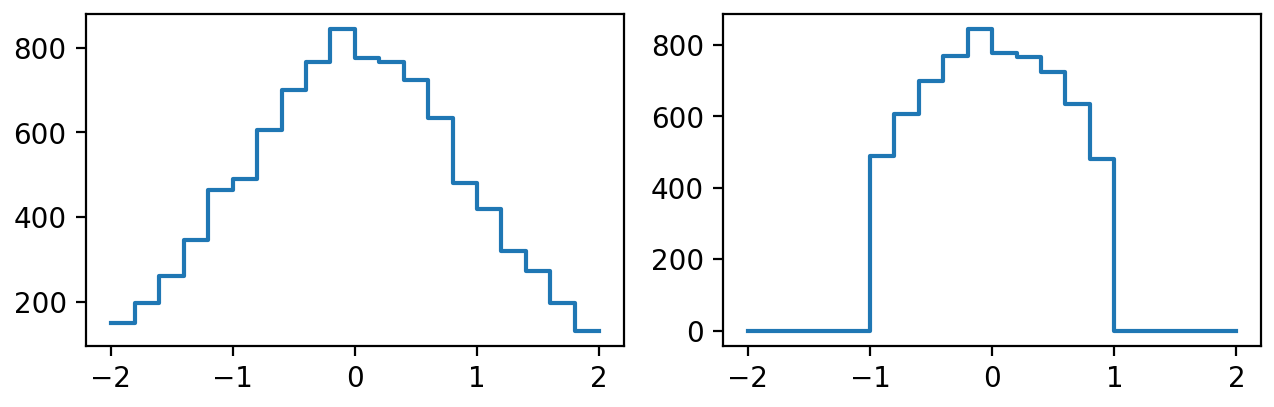
import matplotlib.pyplot as plt
import numpy as np
import atompy as ap

rng = np.random.default_rng(42)
x = rng.normal(size=10_000)

hist = ap.Hist1d(*np.histogram(x, bins=20, range=(-2, 2)))

_, (ax0, ax1) = plt.subplots(1, 2)

for ax in (ax0, ax1):
    ax.set_box_aspect(1./1.618)

ax0.step(*hist.for_step)
ax1.step(*hist.within_range((-1, 1), keepdims=True).for_step)

ap.make_me_nice()
(
Source code,png,hires.png,pdf)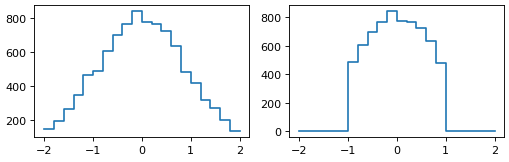