atompy.Hist2d.projected_onto_y#
- property Hist2d.projected_onto_y#
Project histogram onto its y-axis
- Returns:
- hist1d
Hist1d A 1D histogram where the bins are the x-bins of the original 2D histogram, and the bin-values are the projection.
- hist1d
Examples
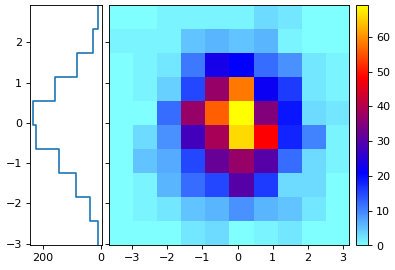
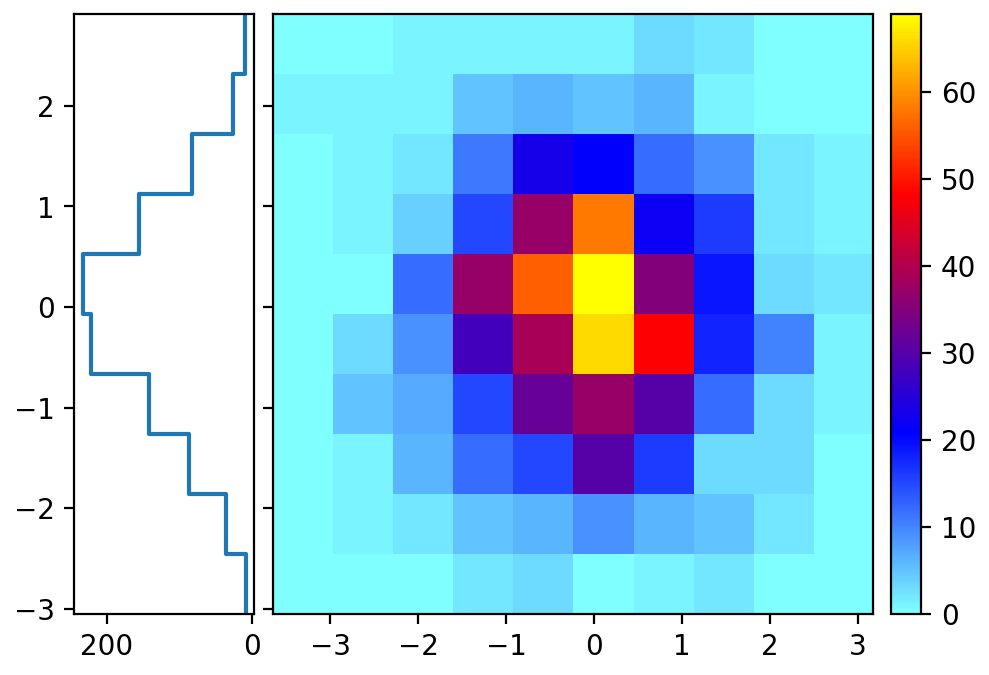
import matplotlib.pyplot as plt
import numpy as np
import atompy as ap

# config and create a figure
plt.rcParams["image.cmap"] = "atom"
plt.rcParams["image.interpolation"] = "none"
plt.rcParams["image.aspect"] = "auto"

_, axs = plt.subplots(1, 2, sharey=True)

# formatting of axes sizes
w, h = 3.0, 3.0
ap.set_axes_size(w, h, axs[1])
ap.set_axes_size(w*0.3, h, axs[0])

# example data
gen = np.random.default_rng(42)
hist2d = ap.Hist2d(*np.histogram2d(*gen.normal(size=(2, 1_000))))
hist1d = hist2d.projected_onto_y

# plotting
axs[0].step(hist1d.for_step[1][::-1], hist1d.for_step[0][::-1])
axs[0].invert_xaxis()
im = axs[1].imshow(**hist2d.for_imshow())

ap.add_colorbar(im, axs[1])

ap.make_me_nice(col_pad_pts=1, fix_figwidth=False)
(
Source code,png,hires.png,pdf)