atompy.Hist2d.normalized_to_max#
- property Hist2d.normalized_to_max#
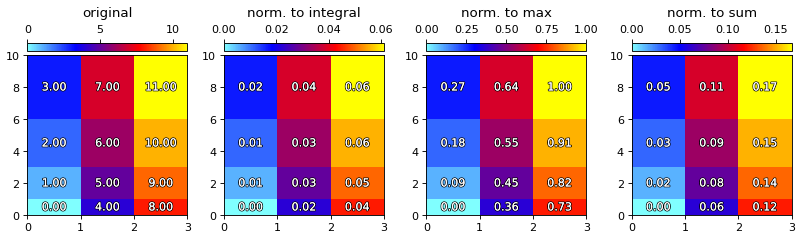
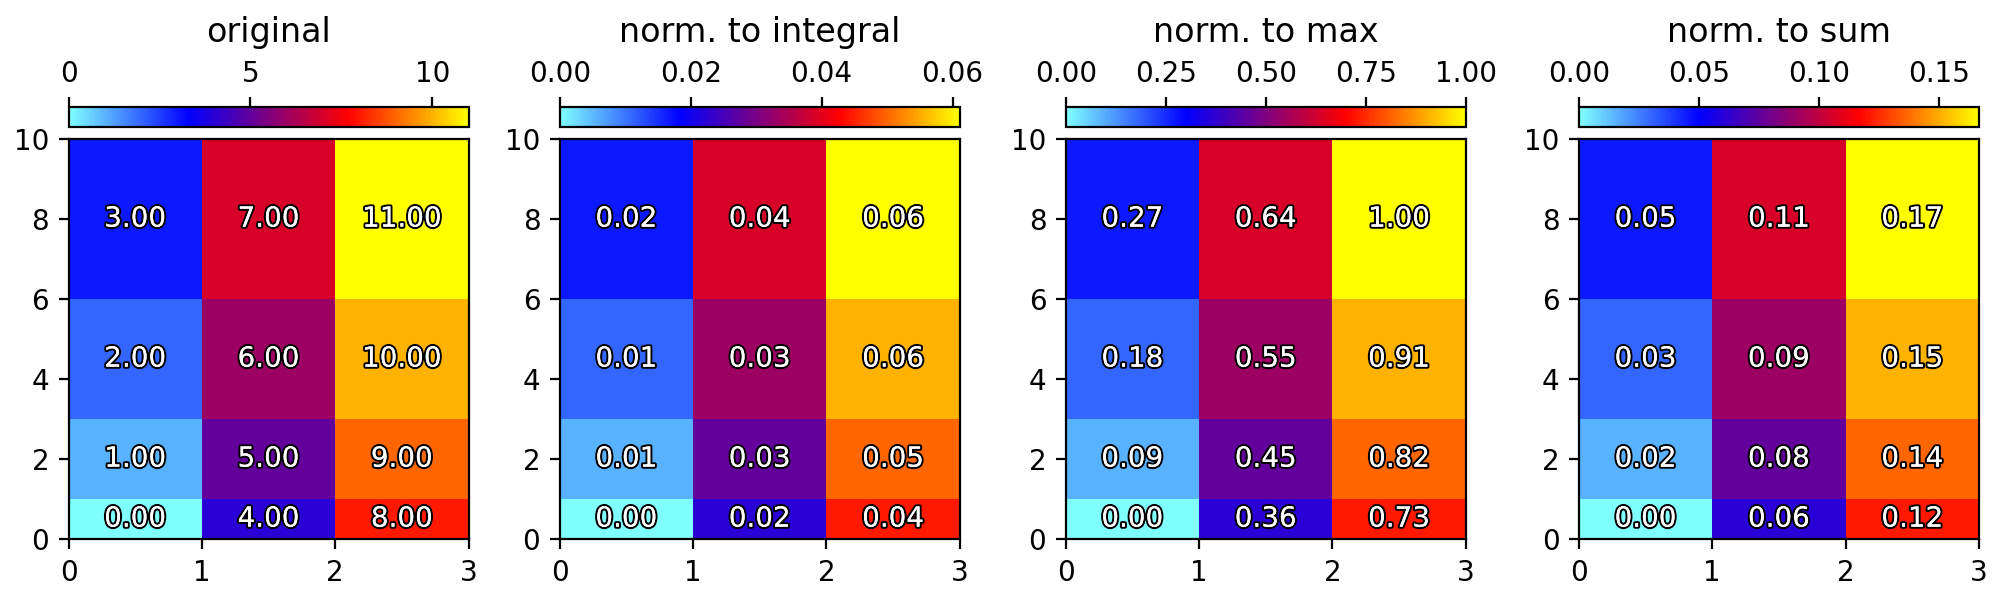
Normalize histogram to it’s maximum.
- Returns:
- normalized_hist2d
Hist2d A new histogram where each bin value is divided by the histogram’s maximum.
- normalized_hist2d
See also
Examples
import atompy as ap
import numpy as np
import matplotlib.pyplot as plt
import matplotlib.patheffects as patheffects


# create a Histogram
xedges = np.array([0, 1, 2, 3])
yedges = np.array([0, 1, 3, 6, 10])
values = np.array(
    [
        [0, 1, 2, 3],
        [4, 5, 6, 7],
        [8, 9, 10, 11],
    ]
)
hist = ap.Hist2d(values, xedges, yedges)
hists = [
    hist,
    hist.normalized_to_integral,
    hist.normalized_to_max,
    hist.normalized_to_sum,
]

# plot different normalizations
titles = "original;norm. to integral;norm. to max;norm. to sum".split(";")

_, (ax0, ax1, ax2, ax3) = plt.subplots(1, 4)

for i, ax in enumerate((ax0, ax1, ax2, ax3)):
    ax.set_title(titles[i], pad=35)
    im = ax.pcolormesh(*hists[i].for_pcolormesh, rasterized=True, cmap="atom")
    ap.set_axes_size(2.0, 2.0, ax)
    ap.add_colorbar(im, ax, location="top")

    # show values of bin in plot
    for j, x in enumerate(hists[i].xcenters):
        for k, y in enumerate(hists[i].ycenters):
            text = ax.text(
                x, y, f"{hists[i].H[j, k]:.2f}", va="center", ha="center", c="w"
            )
            text.set_path_effects(
                [
                    patheffects.withStroke(linewidth=1.5, foreground="k"),
                    patheffects.Normal(),
                ]
            )

ap.make_me_nice(fix_figwidth=False)
(
Source code,png,hires.png,pdf)