Resizing Axes#
matplotlib provides multiple ways to maximize the size of the axes such
that everything still fits. This includes:
Setting
bbox_inches = "tight"inmatplotlib.pyplot.savefig().
These work all within the figure, meaning that the size of the figure is overall not changed. For a fixed aspect ratio of the axes, however, the height of the figure depends on the width. None of the methods listed above adjust the height of the figure to match a desired aspect ratio of the axes and maximize the used area of the figure.
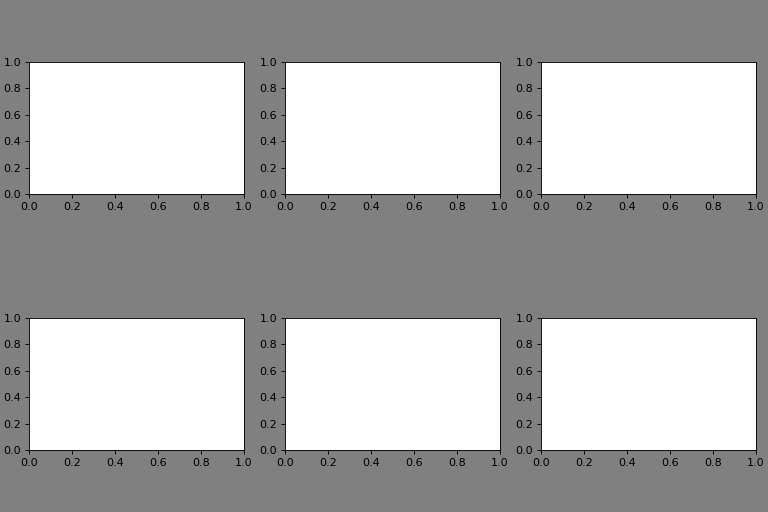
This may have some shortcomings, as the following example showcases:
import matplotlib.pyplot as plt

plt.rcParams["figure.constrained_layout.use"] = True
plt.rcParams["figure.facecolor"] = "grey"

fig, axs = plt.subplots(2, 3, figsize=(3.2*3, 3.2*2))

for ax in axs.flatten():
    ax.set_box_aspect(1/1.618)
(Source code, png, hires.png, pdf)

As one can see, since the height of the figure is fixed, a lot of space is wasted. One could manually adjust the height to a more appropriate value, but that is tedious.
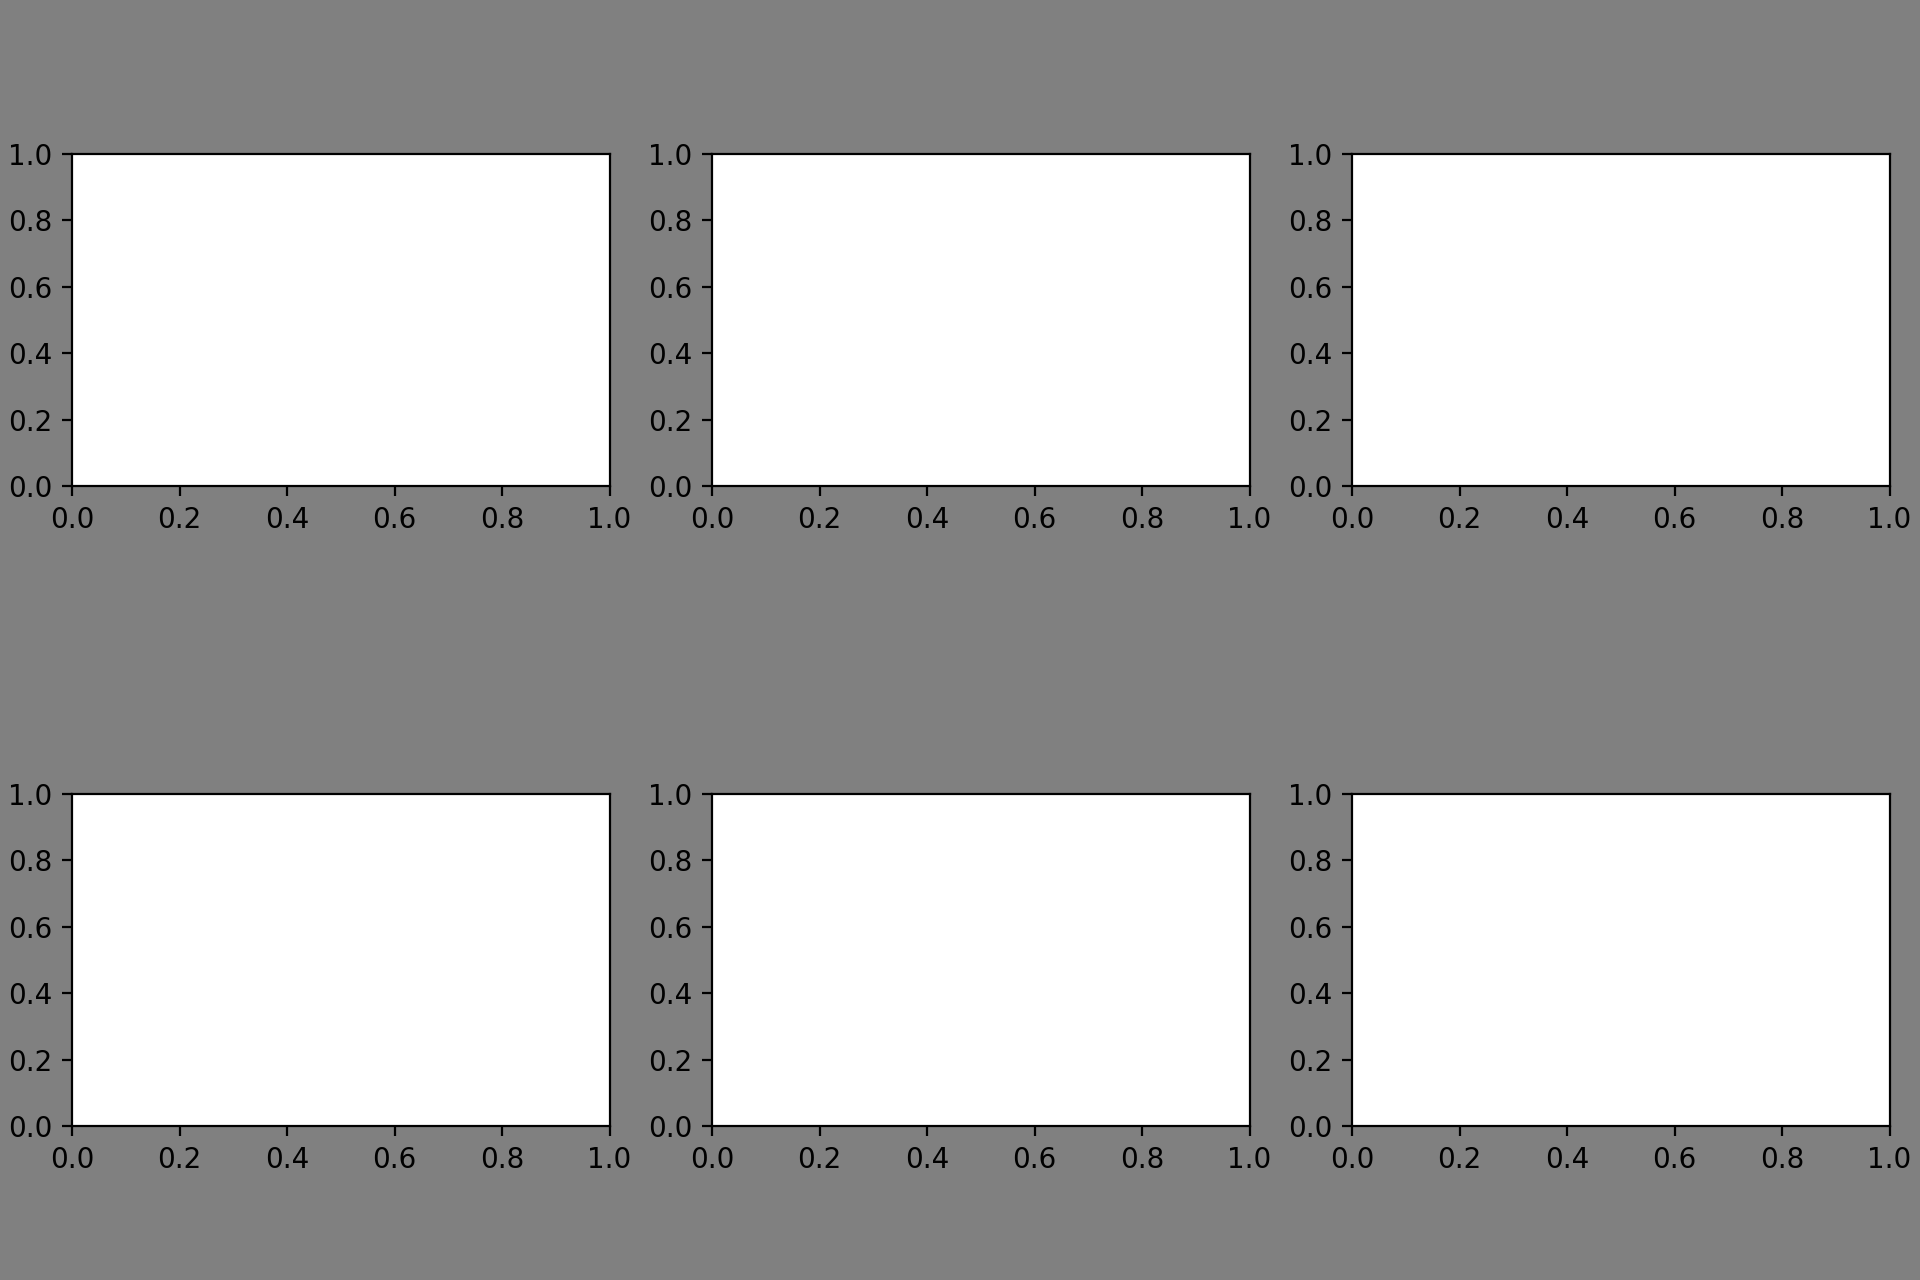
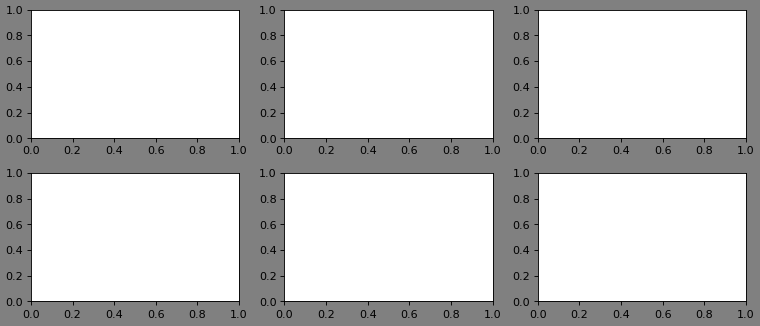
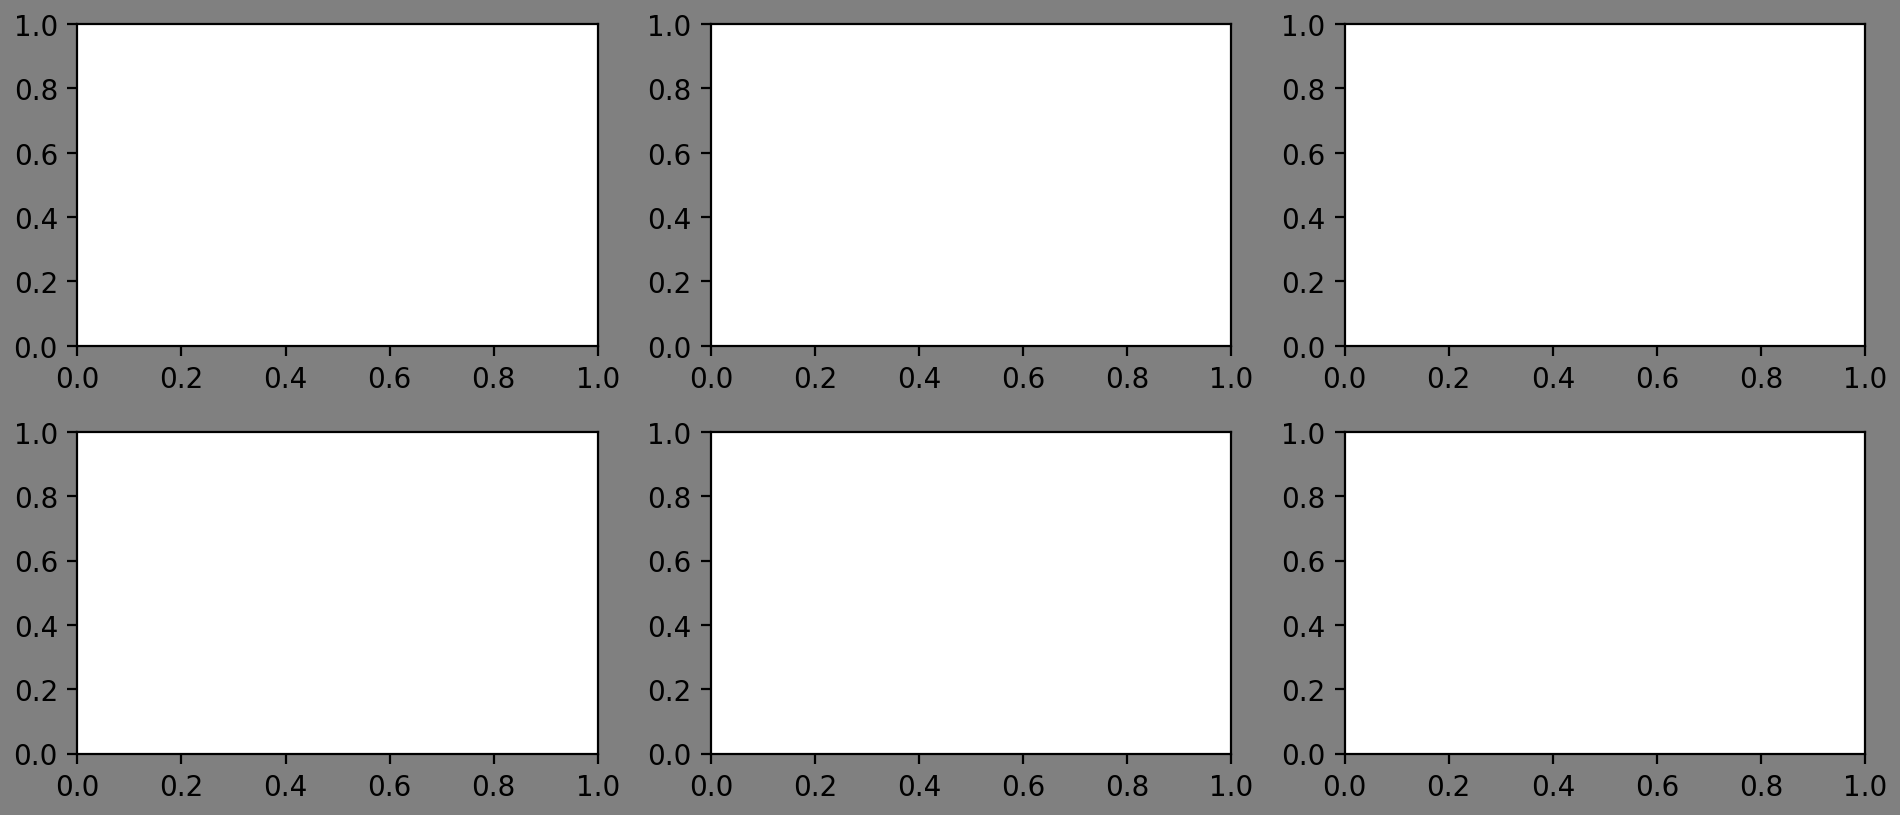
Compare this to the atompy way:
import matplotlib.pyplot as plt
import atompy as ap

plt.rcParams["figure.facecolor"] = "grey"

fig, axs = plt.subplots(2, 3, figsize=(3.2*3, 3.2*2))

for ax in axs.flatten():
    ax.set_box_aspect(1/1.618)

ap.make_me_nice()
(Source code, png, hires.png, pdf)

Of course, make_me_nice() has its own shortcomings. It can only
handle n \(\times\) m grids (i.e., axes cannot span multiple rows or
columns). But for most use-cases, it should suffice.
Additionaly, it handles colorbars much nicer. See Colormaps and Colorbars for more information.
See the documentation page of make_me_nice() for the full
functionality.
Unexpected bahaviour and workarounds#
Fixed position and fixed aspect ratios#
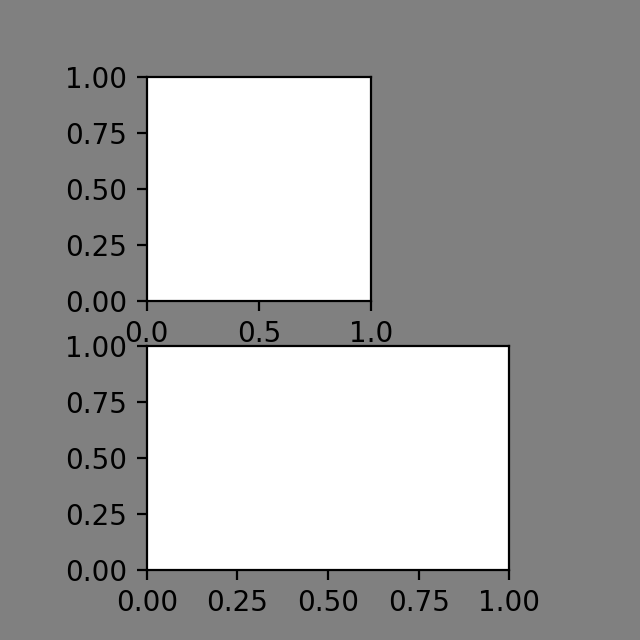
Let’s say you have the following setup: The top-row axes is narrower than the
bottom row axes and you want to align it to the edges. You can do this using
the matplotlib.axes.Axes.set_position and matplotlib.axes.Axes.get_position.
import matplotlib.pyplot as plt
import atompy as ap

plt.rcParams["figure.facecolor"] = "grey"

fig, axs = plt.subplots(2, 1, figsize=(3.2, 3.2))

axs[0].set_box_aspect(1.)

axs[1].set_box_aspect(1./1.618)

# align top left axes to left edge
tmp = axs[0].get_position()
axs[0].set_position([axs[1].get_position().x0,
                       tmp.y0,
                       tmp.width,
                       tmp.height])
(Source code, png, hires.png, pdf)

If you now add ap.make_me_nice(), you get the following:
(Source code, png, hires.png, pdf)

As one can see, the top axes is not aligned
propperly any more. One unfortunately has to re-align the top row for it to
work. As this is a necessity, atompy provides some methods to streamline
the process, namely align_axes_horizontally() and
align_axes_vertically().
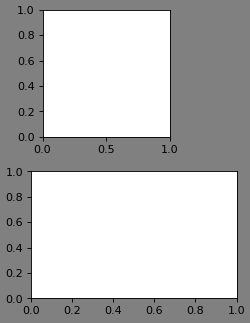
Let’s adjust the code:
import matplotlib.pyplot as plt
import atompy as ap

plt.rcParams["figure.facecolor"] = "grey"

fig, axs = plt.subplots(2, 1, figsize=(3.2, 3.2))

axs[0].set_box_aspect(1.0)
axs[1].set_box_aspect(1./1.618)

ap.make_me_nice()

ap.align_axes_horizontally(axs[0], axs[1], alignment="right")

plt.show()
(Source code, png, hires.png, pdf)

Proper alignment!
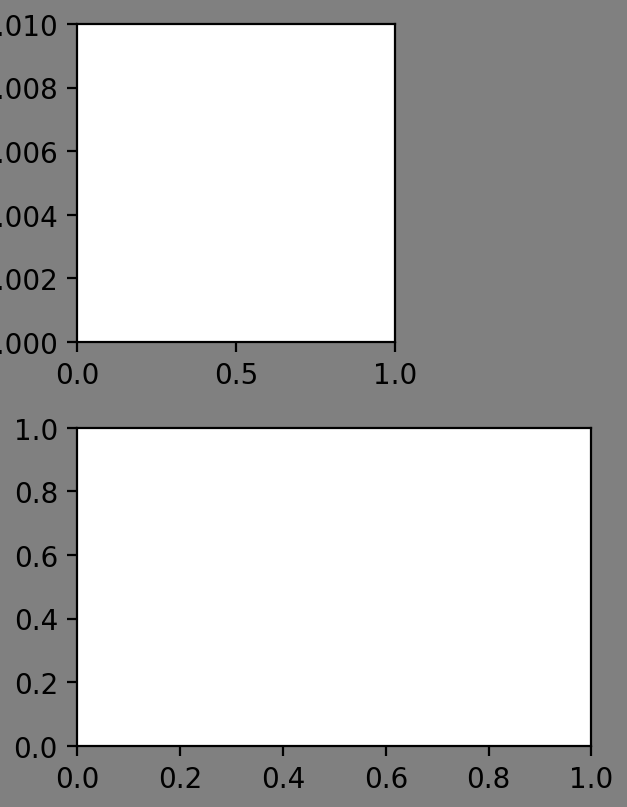
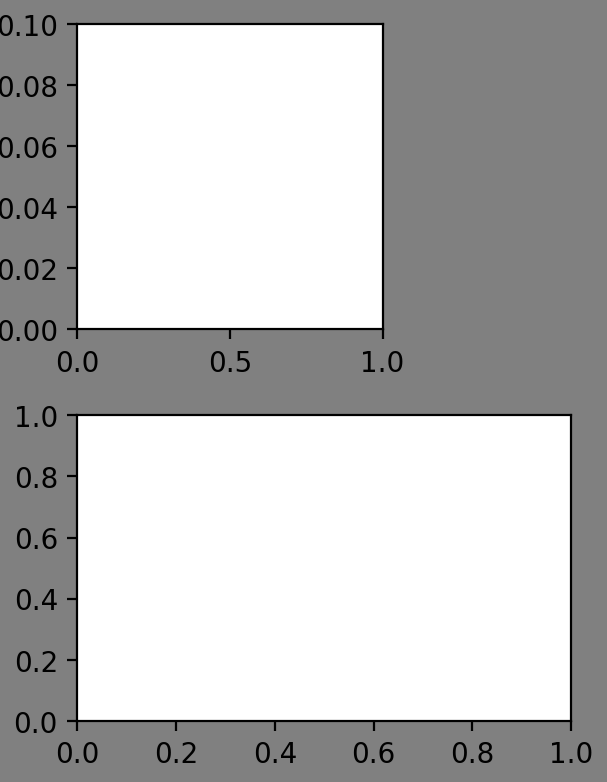
… unless, of course, a situation like this arises:
(Source code, png, hires.png, pdf)

Note that the required x-padding is larger for the upper axes. However, since
the axes is re-aligned after the call to make_me_nice(), the required
x-padding for the lower axes is used. Of course, that is wrong.
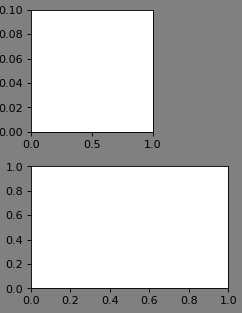
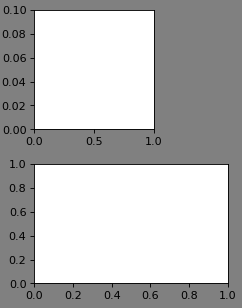
The solution: Throw align_axes_horizontally() around more liberally:
import matplotlib.pyplot as plt
import atompy as ap

plt.rcParams["figure.facecolor"] = "grey"

fig, axs = plt.subplots(2, 1, figsize=(3.2, 3.2))

axs[0].set_box_aspect(1.0)
axs[1].set_box_aspect(1./1.618)

axs[0].set_ylim(0.0, 0.1)

ap.align_axes_horizontally(axs[0], axs[1], alignment="right")

ap.make_me_nice()

ap.align_axes_horizontally(axs[0], axs[1], alignment="right")
(Source code, png, hires.png, pdf)

And yet, since we live in a volatile universe where the depths of infitity reach out into the pits of that-what-shall-not and nothing is certain but the uncertainty of life, this still does not result in propper alignment.
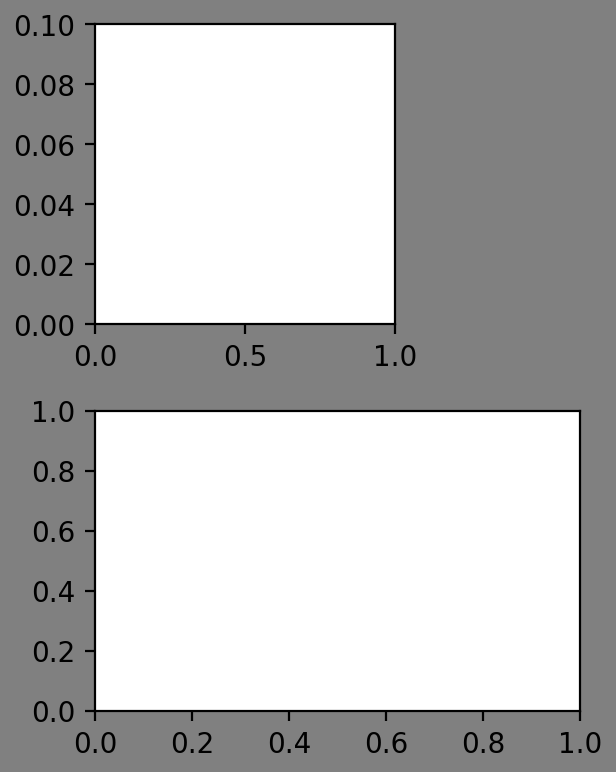
If all fails, you can always do minor corrections using the margin_pad_pts
keyword:
import matplotlib.pyplot as plt
import atompy as ap

plt.rcParams["figure.facecolor"] = "grey"

fig, axs = plt.subplots(2, 1, figsize=(3.2, 3.2))

axs[0].set_box_aspect(1.0)
axs[1].set_box_aspect(1./1.618)

axs[0].set_ylim(0.0, 0.1)

ap.align_axes_horizontally(axs[0], axs[1], alignment="right")

ap.make_me_nice(margin_pad_pts=(8.0, 5.0, 5.0, 5.0))  # left, right, top, bottom

ap.align_axes_horizontally(axs[0], axs[1], alignment="right")
(Source code, png, hires.png, pdf)

Alternatively, one can use a fixed axes size (instead of a fixed figure size). Then, these problems should not arise.
import matplotlib.pyplot as plt
import atompy as ap

plt.rcParams["figure.facecolor"] = "grey"

fh, ah = 3.2, 1.5

fig, axs = plt.subplots(2, 1, figsize=(fh, fh))

ap.set_axes_size(ah, ah, axs[0], anchor="left")
ap.set_axes_size(ah*1.618, ah, axs[1], anchor="left")

axs[0].set_ylim(0.0, 0.1)

ap.make_me_nice(fix_figwidth=False, max_figwidth=fh)
(Source code, png, hires.png, pdf)

Using the optional keyword max_figwidth=True, one ensures that the new
figure width is not larger than the desired figure width, which, in turn,
ensures that the resulting graphic will not reach into the margins of a text
(in the example, the text width would be specified by fh).