Colormaps and Colorbars#
Add colorbar to plots#
Attaching a colorbar to a plot in matplotlib is quite flexible and,
hence, quite cumbersome. While adding a basic colorbar is quite easy (see
here
for a matplotlib tutorial),
scaling the colorbar correctly can become challenging. The following example
hopefully showcases this:
import matplotlib.pyplot as plt
import numpy as np
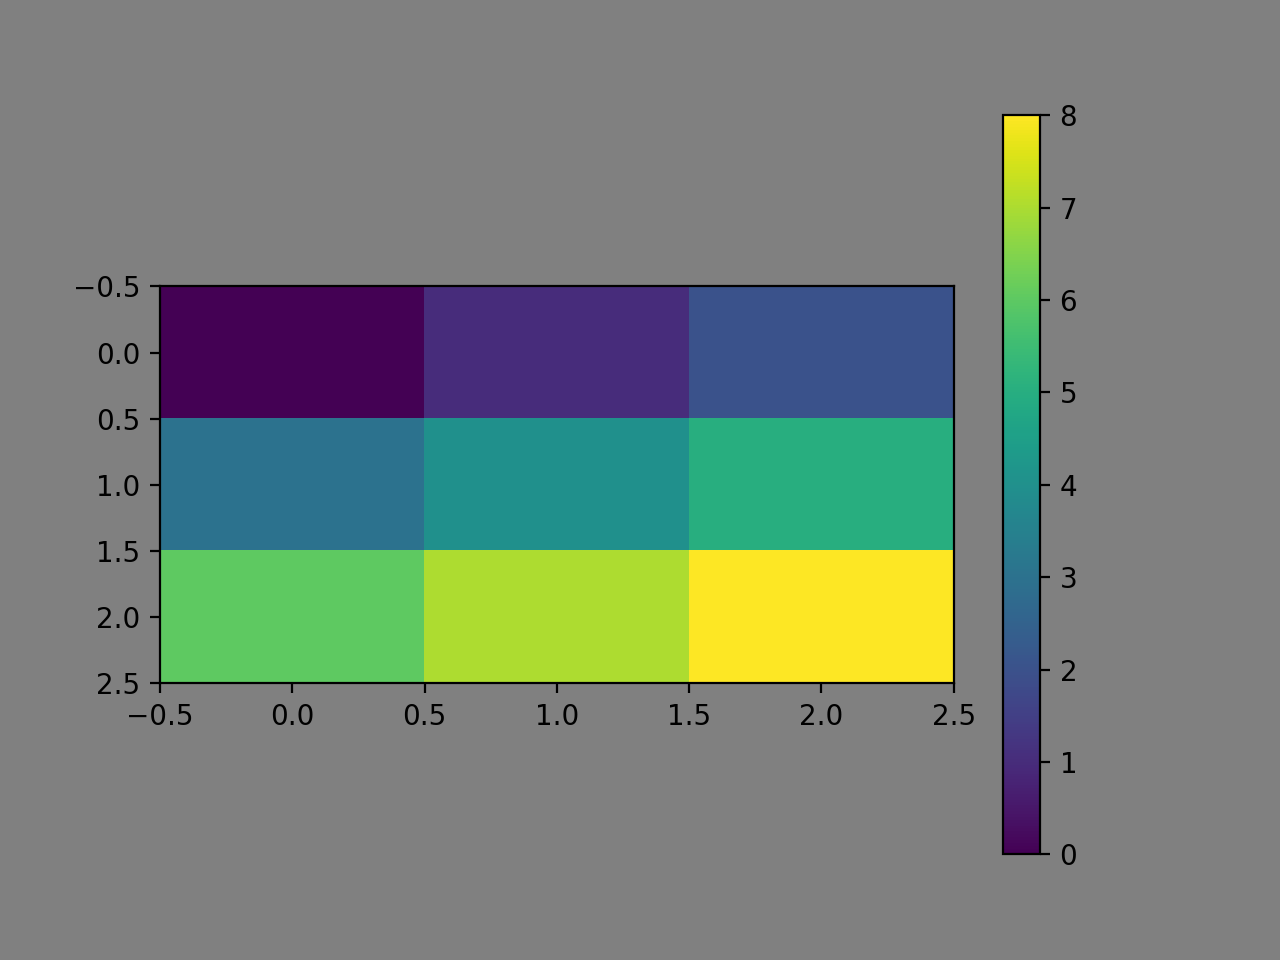
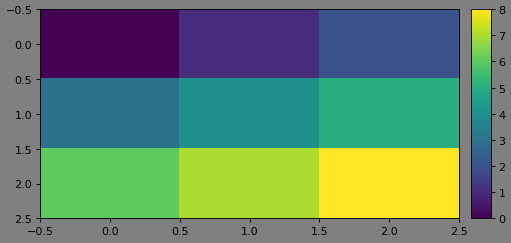
# create a 2D plot with a "custom" aspect ratio
plt.imshow(np.reshape(np.arange(9), (3,3)), aspect="auto")
plt.gca().set_box_aspect(0.5)
# add a colorbar
# in this simple form, it does not properly scale to the 2D plot
plt.colorbar()
plt.gcf().patch.set_facecolor("grey")
(Source code, png, hires.png, pdf)
As one can see, the colorbar is scaled incorrectly (I’d say). Of course, there
are ways around this… one of them, if you’re using atompy, is
add_colorbar():
import matplotlib.pyplot as plt
import numpy as np
import atompy as ap
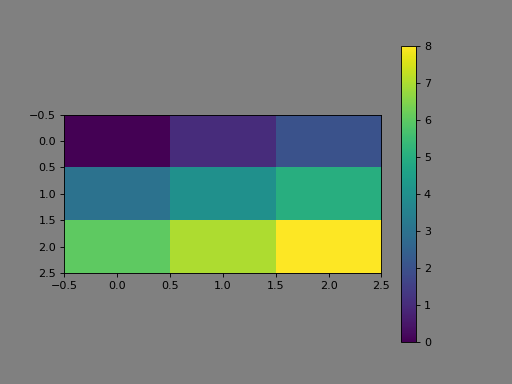
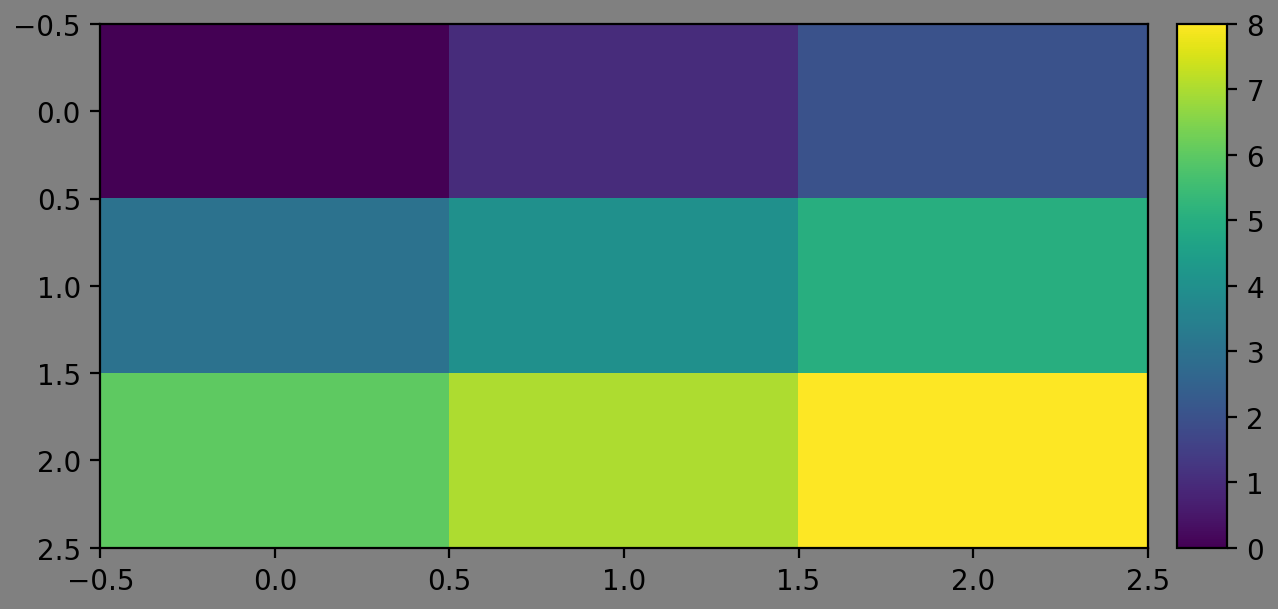
# create a 2D plot with a "custom" aspect ratio
image = plt.imshow(np.reshape(np.arange(9), (3,3)), aspect="auto")
plt.gca().set_box_aspect(0.5)
# Add a colorbar that now scales correctly to the 2D plot
ap.add_colorbar(image)
plt.gcf().patch.set_facecolor("grey")
(Source code, png, hires.png, pdf)

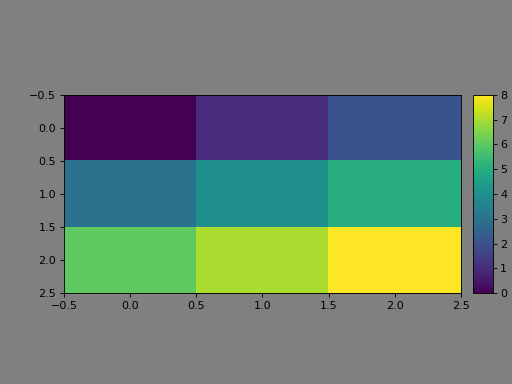
Additionaly, you can now use make_me_nice() to maximize whitespace of
the figure. Adding ap.make_me_nice() to the above code yields:
(Source code, png, hires.png, pdf)

For a better overview of the provided functionality, see the documentation page
of add_colorbar().
Note
If you plan to use make_me_nice(), you must add colorbars
using add_colorbar().
Creating custom colormaps#
Sometimes it’s useful to create custom colormaps that aren’t already available
(you can go through the build in colormaps from matplotlib
here).
Yo create custom colormaps using
matplotlib.colors.LinearSegmentedColormap.
In particular, if your colormap does not have any discontinuous jumps in it,
you can use from_list.
For example, a colormap that goes red-green-blue is implemented like this:
from matplotlib.colors import LinearSegmentedColormap

cm_rgb = LinearSegmentedColormap.from_list(
    "red_green_blue", # name of the colormap
    (0.0, (1.0, 0.0, 0.0)),  # red   to green from 0%  to 50%
    (0.5, (0.0, 1.0, 0.0)),  # green to blue  from 50% to 100%
    (1.0, (0.0, 0.0, 1.0))
)
Now, one can use the colormap in, e.g., matplotlib.pyplot.imshow():
import matplotlib.pyplot as plt

plt.imshow(image, cmap=cm_rgb)
Register a colormap#
matplotlib has a register of colormaps, so one can refer to them using
strings, e.g.:
plt.imshow(image, cmap="viridis")
Or, one can set a default colormap, removing the need of the keyword argument, e.g.:
plt.rcParams["image.cmap"] = "cividis"
plt.imshow(image)
You can register your own custom colormap, adding this functionality:
import matplotlib.colormaps

matplotlib.colormaps.register(cm_rgb)

plt.rcParams["image.cmap"] = "red_green_blue"
plt.imshow(image)