atompy.add_colorbar#
- atompy.add_colorbar(mappable, ax=None, location='right', thickness_pts=None, pad_pts=None)[source]#
Add a colorbar to axes.
Create a new
matplotlib.axes.Axesnext to ax with the same height (or width), then plot amatplotlib.color.Colorbarin it.If you change the figure-layout after the fact, you can update the colorbar position with
update_colorbars().- Parameters:
- mappable
matplotlib.cm.ScalarMappable The colormap described by this colorbar.
For more information, see matplotlib.pyplot.colorbar.
- ax
matplotlib.axes.Axes, optional The axes to which the colorbar is added.
If
None, use currently active axes.- location{“left”, “right”, “top”, “bottom”}, default:
"right" Location of the colorbar relative to ax.
- thickness_pts
float, optional The thickness of the colorbar in pts.
If
None, the width will be 5% of the current width (or height, depending on location) of the axes.- pad_pts
float, optional The pad between the colorbar and axes in pts.
If
None, the pad will be 60% of thickness_pts.
- mappable
- Returns:
- colorbar
matplotlib.colorbar.Colorbar
- colorbar
Examples
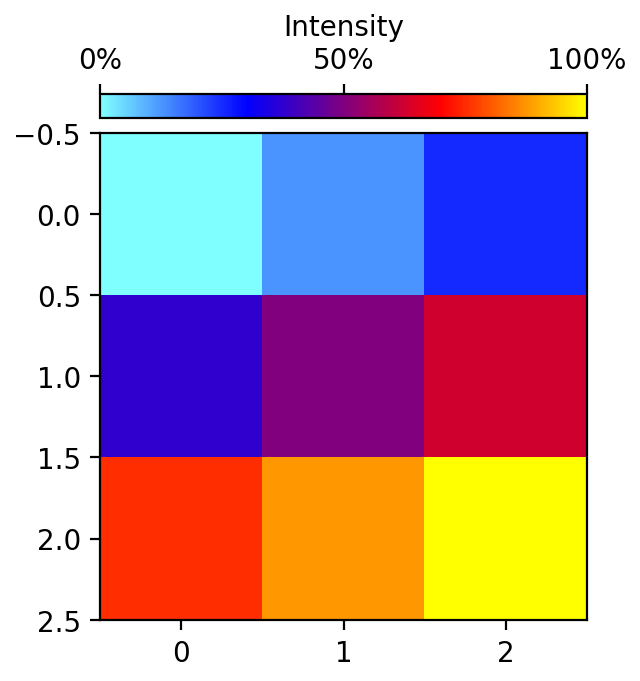
import atompy as ap
import numpy as np
import matplotlib.pyplot as plt

# configure standard image parameters
plt.rcParams["image.cmap"] = "atom"  # works only if atompy is imported
plt.rcParams["image.interpolation"] = "none"
plt.rcParams["image.aspect"] = "auto"

_, ax = plt.subplots(figsize=(3.2, 3.2))
ax.set_box_aspect(1.0)

image = ax.imshow(np.arange(9).reshape((3, 3)))

colorbar = ap.add_colorbar(image, ax, location="top")

# modify colorbar after its creation
tick_max = colorbar.ax.get_xlim()[1]
colorbar.set_label("Intensity")
locs = [0, 0.5, 1.0]
colorbar.ax.set_xticks(
    ticks=[l*tick_max for l in locs],
    labels=[f"{l*100:.0f}%" for l in locs])

ap.make_me_nice()
(
Source code,png,hires.png,pdf)