atompy._set_theme_atompy#
- atompy._set_theme_atompy(spines='', spines_color='#AFAFAF', use_latex=True, fontsize=10.0, use_serif=True)[source]#
Sets a theme me likes.
Attention
The default behavior of this function may change without further notice. Do not assume that the behavior will stay constant over multiple versions of
atompy.If the behavior changes, however, it will be listed in the changelog.
- Parameters:
- spines
str, default “” Any combination of
"l","b","t","r". E.g.,"lb"would enable the left and bottom spines of the axes.""disables all spines.- use_latexbool, default
True Use a latex backend for rendering. May be slow.
- fontsize
float, default 10 pts - use_serifbool, default
True Use a font-family with serifs. If
False, use a sans-serif font family.
- spines
Examples
import atompy as ap
import matplotlib.pyplot as plt

ap._set_theme_atompy(use_latex=False, use_serif=False)

_, axs = plt.subplot_mosaic([["A", "B"]])

for i in range(7):
    axs["A"].plot((0, 6), (i, 6+i), label=f"$x+{i}$")
axs["A"].legend(loc="upper left", bbox_to_anchor=(1, 1))
axs["A"].set_xlabel("$x$")
axs["A"].set_ylabel("$f(x)$")
axs["A"].set_title("Lines")
ap.set_axes_size(3, 3*0.75, axs["A"])

hist = ap.load_2d_from_root("example.root",
                            "He_Compton/electrons/momenta/px_vs_py",
                            output_format="Hist2d")
im = axs["B"].pcolormesh(*hist.without_zeros.for_pcolormesh, rasterized=True)
axs["B"].set_xlabel("$p_x$ (a.u.)")
axs["B"].set_ylabel("$p_y$ (a.u.)")
axs["B"].set_title("Momenta")
ap.set_axes_size(3*0.75, 3*0.75, axs["B"])
cb = ap.add_colorbar(im, axs["B"])
cb.set_label("Yield (counts)")

ap.make_me_nice(fix_figwidth=False, col_pad_pts=15)
ap.add_abc(labels=None, weight="bold")
(
Source code,png,hires.png,pdf)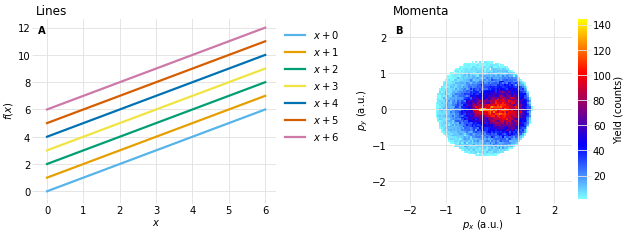