atompy.create_2d_plot#
- atompy.create_2d_plot(*data, plot_kwargs={}, add_colorbar=True, colorbar_kwargs={}, colorbar_label=None, xlabel=None, ylabel=None, title=None, xmin=None, xmax=None, ymin=None, ymax=None, aspect_ratio=1.0, axes_width_inch=2.362204724409449, axes_height_inch=None, make_me_nice=True, make_me_nice_kwargs={})[source]#
Plot 2D data.
- Parameters:
- data(x, y, z) or (image, extents)
Data to be plotted.
If three arrays are passed,
matplotlib.pyplot.pcolormesh()will be used as backend.If two arrays are passed,
matplotlib.pyplot.imshow()will be used as backend.- plot_kwargs
dict, optional Dictionary of keyword arguments passed to either
pcolormeshorimshow.- add_colorbarbool, default
True Add a colorbar to the plot. Positioning and properties are controlled with
colorbar_kwargs. Usesadd_colorbar().- colorbar_kwargs
dict, optional Dictionary of keyword arguments passed to
add_colorbar().- xlabel, ylabel, colorbar_label
str, optional Optional labels added to the x-axis / y-axis / colorbar.
- title
str, optional Optional title of the figure.
- xmin, xmax, ymin, ymax
float, optional Optionally fix the limits of the x/y axis.
- aspect_ratio
float, default 1.0 Aspect ratio (height/width) of the plot.
Ignored, if both
axes_width_inchandaxes_height_inchare provided.- axes_width_inch
float, optional, default 2.36 inch Physical width of the axes in inches. If not provided, it will be determined automatically.
- axes_height_inch
float, optional Physical height of the axes in inches. If not provided, it will be determined automatically.
- make_me_nicebool, default
True Optimize white space in the figure. See docstring of
make_me_nice()for details.- make_me_nice_kwargs
dict, optional Dictionary of keyword arguments passed to
make_me_nice().
- Returns:
- figure
matplotlib.figure.Figure - axes
matplotlib.axes.Axes - colorbar
matplotlib.colorbar.Colorbar Only returned if
add_colorbar == True.
- figure
Examples
Using
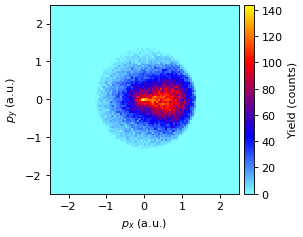
matplotlib.pyplot.pcolormesh()backend:""" Plot a single 2D-Histogram from a ROOT file. """ import atompy as ap import matplotlib.pyplot as plt # load 2D histogram from root file to plot it with imshow x, y, z = ap.load_2d_from_root( "example.root", "He_Compton/electrons/momenta/px_vs_py", output_format="pcolormesh") # format figure plt.rcParams["image.cmap"] = "atom" plt.rcParams["image.aspect"] = "auto" plt.rcParams["image.interpolation"] = "none" fig, ax, cb = ap.create_2d_plot(x, y, z, xlabel=r"$p_x$ (a.u.)", ylabel=r"$p_y$ (a.u.)", colorbar_label="Yield (counts)")
(
Source code,png,hires.png,pdf)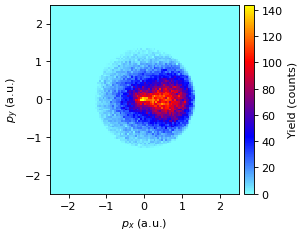
Using
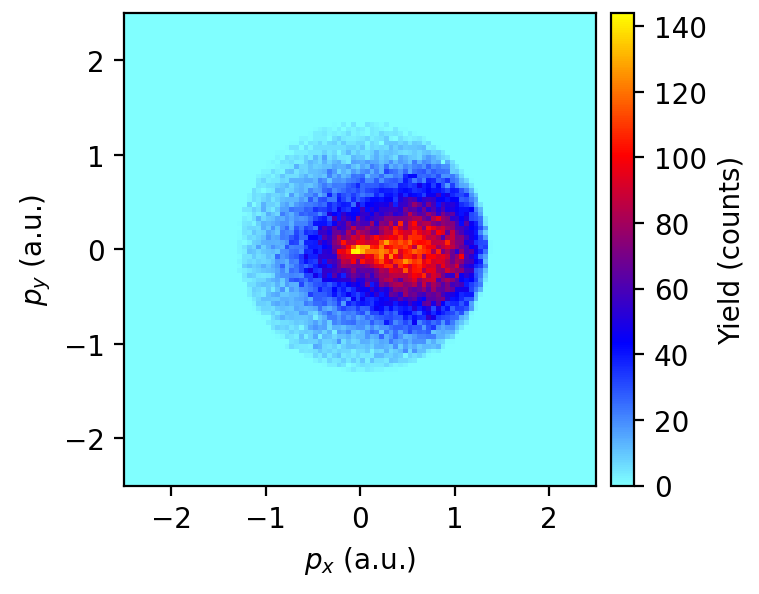
matplotlib.pyplot.imshow()backend:""" Plot a single 2D-Histogram from a ROOT file. """ import atompy as ap import matplotlib.pyplot as plt # load 2D histogram from root file to plot it with imshow image, extents = ap.load_2d_from_root( "example.root", "He_Compton/electrons/momenta/px_vs_py", output_format="imshow") # format figure plt.rcParams["image.cmap"] = "atom" plt.rcParams["image.aspect"] = "auto" plt.rcParams["image.interpolation"] = "none" fig, ax, cb = ap.create_2d_plot(image, extents, xlabel=r"$p_x$ (a.u.)", ylabel=r"$p_y$ (a.u.)", colorbar_label="Yield (counts)")
(
Source code,png,hires.png,pdf)