Constants#
Conversions#
- atompy.PTS_PER_INCH = 72.0 pts/inch#
- atompy.MM_PER_INCH = 25.4 mm/inch#
Figure sizes of various journals#
- atompy.FIGURE_WIDTH_NATURE_1COL = 3.54 inch#
- atompy.FIGURE_WIDTH_NATURE_2COL = 7.09 inch#
- atompy.FIGURE_WIDTH_PRL_1COL = 3.375 inch#
- atompy.FIGURE_WIDTH_PRL_2COL = 6.75 inch#
- atompy.FIGURE_WIDTH_SCIENCE_1COL = 2.25 inch#
- atompy.FIGURE_WIDTH_SCIENCE_2COL = 4.75 inch#
- atompy.FIGURE_WIDTH_SCIENCE_3COL = 7.25 inch#
Colors#
The colors listed below are also wrapped in a tuple colors. One can
access these, e.g., like colors.RED.
- atompy.red = "#AE1117"#
- atompy.teal = "#008081"#
- atompy.blue = "#2768F5"#
- atompy.green = "#007F00"#
- atompy.grey = "#404040"#
- atompy.orange = "#FD8D3C"#
- atompy.pink = "#D4B9DA"#
- atompy.yellow = "#FCE205"#
- atompy.lemon = "#EFFD5F"#
- atompy.corn = "#E4CD05"#
- atompy.purple = "#CA8DFD"#
- atompy.dark_purple = "#9300FF"#
- atompy.forest_green = "#0B6623"#
- atompy.bright_green = "#3BB143"#
Color Palettes#
See the excellent book Fundamentals of Data Visualization by Claus O. Wilke for a motivation of these color palettes.
The below color palettes can be used automatically by
matplotlib.axes.Axes by updating its cycler (see the respective documentation
at matplotlib.org.)
Alternativley, atompy provides the set_color_cycle() method to
achieve this more conveniently.
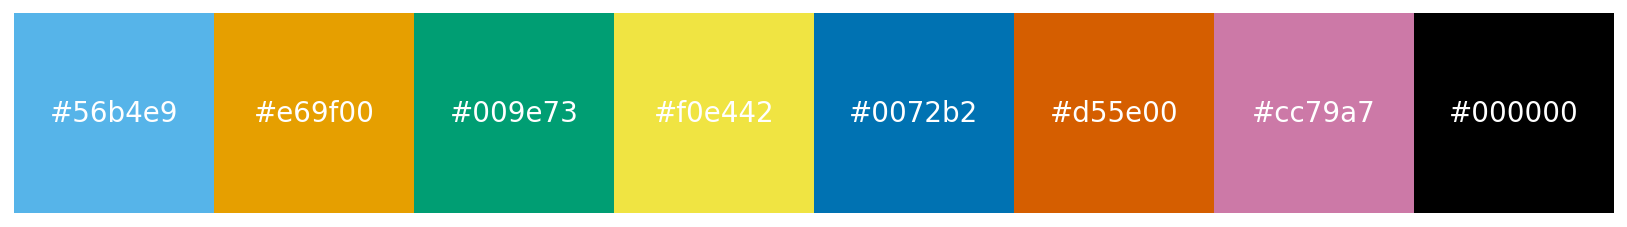
- atompy.PALETTE_OKABE_ITO#
(
Source code,png,hires.png,pdf)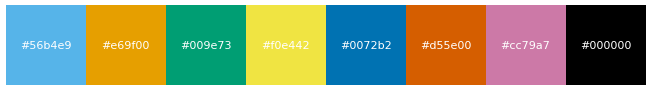
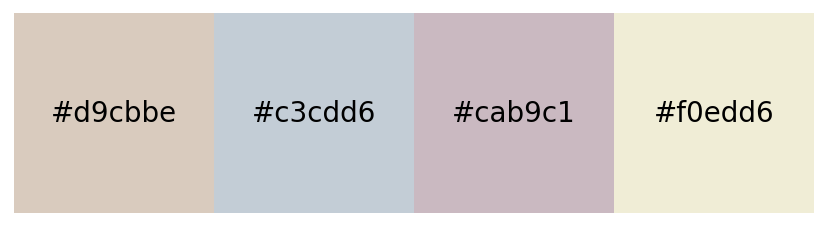
- atompy.PALETTE_OKABE_ITO_MUTE#
(
Source code,png,hires.png,pdf)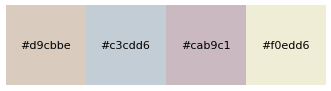
- atompy.PALETTE_OKABE_ITO_ACCENT#
(
Source code,png,hires.png,pdf)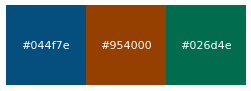
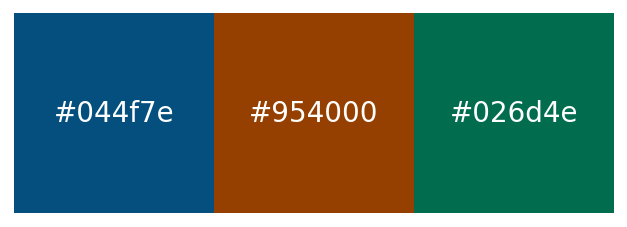
- atompy.PALETTE_COLORBREWER_DARK2#
(
Source code,png,hires.png,pdf)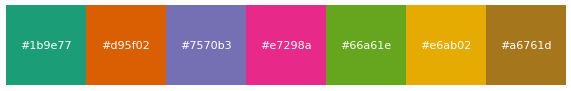
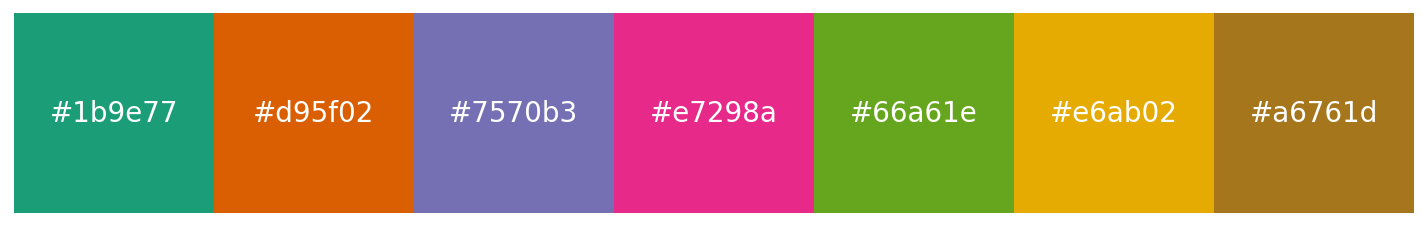
- atompy.PALETTE_COLORBREWER_MUTE#
(
Source code,png,hires.png,pdf)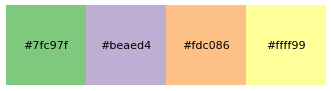
- atompy.PALETTE_COLORBREWER_ACCENT#
(
Source code,png,hires.png,pdf)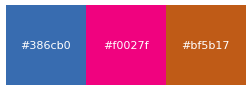