atompy.dashed#
- atompy.dashed(ratio=1.5, n_dashes=4, linewidth=None, fontsize=None, legend_handlelength=None, **aliases)[source]#
Return a tuple to create a dashed line that fits perfectly into a legend. For that to work properly you may need to provide the linewidth of the graph and the fontsize of the legend.
- Parameters:
- ratio
float, default: 1.5 Ratio between dash-length and gap-length
- n_dashes
int, default: 4 Number of dashes drawn
- linewidth (or lw)
float, optional, default: rcParams[“lines.linewidth”] - fontsize
floatorstr, Optional, default: rcParams[“legend.fontsize”] The fontsize used in the legend
float: fontsize in pts
str:
"xx-small","x-small","small","medium","large","x-large","xx-large","larger", or"smaller"
- legend_handlelength (or lh)
float, defaultrcParams["legend.handlelength"] Length of the legend handles (the dotted line, in this case) in font units
- ratio
- Returns:
See also
dotted()Create dotted-line linestyle.
dash_dotted()Create dash-dotted-line linestyle.
Examples
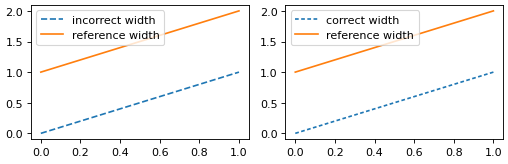
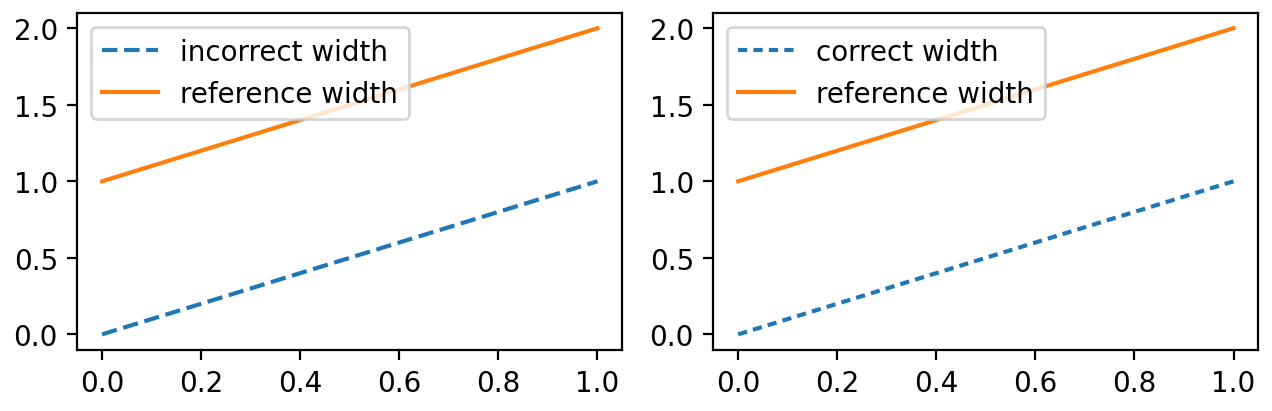
import matplotlib.pyplot as plt
import atompy as ap

_, (ax0, ax1) = plt.subplots(1, 2)

ax0.plot([0, 1], ls="dashed", label="incorrect width")
ax0.plot([1, 2], ls="-", label="reference width")
ax1.plot([0, 1], ls=ap.dashed(), label="correct width")
ax1.plot([1, 2], ls="-", label="reference width")

for ax in (ax0, ax1):
    ax.set_box_aspect(1./1.618)
    ax.legend()

ap.make_me_nice()
(
Source code,png,hires.png,pdf)