Create histograms#
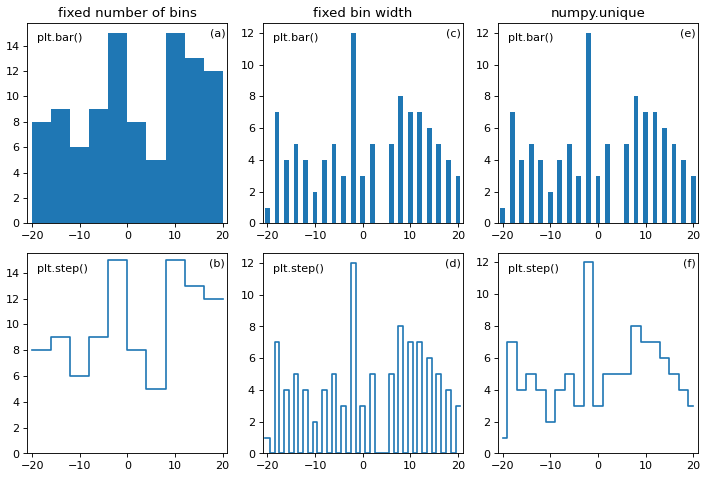
In the following code, three methods are used to create a histogram of a discrete dataset.
The first method (a,b) creates a histogram using numpy.histogram() with a
fixed number of bins, the second (c,d) with a fixed bin width, and the third
(e,f) with numpy.unique().
numpy.unique() counts the occurance of each value in the dataset.
Choosing the appropriate bin width (in this case, 1),
numpy.histogram() reproduces the output of numpy.unique().
However, care is to be taken when plotting the two histograms. As one can see,
plotting using matplotlib.pyplot.step() and
matplotlib.pyplot.bar() produce different outputs for both histograming
methods, even though they should be the same.
By default, numpy.histogram() performs the histogramming with a fixed
number of bins. As one can see in Panels (a) and (b), the choice of how many
bins are used influences the representation of the data. This can be desirable
or not.
This chapter
from the excellent book
Fundamentals of Data Visualization by Claus O. Wilke talks a little bit on
the importance of properly binning histograms. Also check out the documentation
of numpy.histogram_bin_edges().
import numpy as np
import matplotlib.pyplot as plt
import atompy as ap
from math import nextafter

_, axs = plt.subplots(2, 3)

data = 2 * np.random.default_rng(42).integers(-10, 11, 100)

# histogram with fixed number of bins
nbins = 10
hist1 = ap.Hist1d(*np.histogram(data, bins=nbins))

axs[0, 0].set_title("fixed number of bins")
axs[0, 0].bar(*hist1.for_plot, width=hist1.binwidths)
axs[1, 0].step(*hist1.for_step)


# histogram with fixed width of bins
binwidth = 1.0
start = data.min() - binwidth / 2.0
stop = data.max() + binwidth
bin_edges = np.arange(start, stop, binwidth)
hist2 = ap.Hist1d(*np.histogram(data, bins=bin_edges))

axs[0, 1].set_title(f"fixed bin width")
axs[0, 1].bar(*hist2.for_plot, width=hist2.binwidths)
axs[1, 1].step(*hist2.for_step)

# histogram counting the occurance of values
axs[0, 2].set_title(f"numpy.unique")
axs[0, 2].bar(*np.unique(data, return_counts=True), width=1)
axs[1, 2].step(*np.unique(data, return_counts=True), where="mid")


for ax in axs.flat:
    ap.set_axes_size(2.5, 2.5, ax)
    ax.set_xlim(-21, 21)
    ax.set_ylim(bottom=0)

for ax in axs[0]:
    ax.text(0.05, 0.95, "plt.bar()", transform=ax.transAxes, va="top")

for ax in axs[1]:
    ax.text(0.05, 0.95, "plt.step()", transform=ax.transAxes, va="top")

ap.add_abc(anchor="top right", ha="right", xoffset_pts=-2, rowsfirst=False)
ap.make_me_nice(fix_figwidth=False)
(Source code, png, hires.png, pdf)
