keep#
- Hist1d.keep(lower, upper, squeeze=False, setval=0.0)[source]#
Keep every entry of the histogram in-between lower and upper
- Parameters:
- lower
float Keep all data where the left
edgesare greater or equal to lower.- upper
float Keep all data where the right
edgesare lesser or equal to upper.- squeezebool, default
False Controls if the resulting
Hist1dhas the same number of bins as the original histogram.- setval
float, default 0.0 If squeeze is False, fill removed data with setval.
- lower
- Returns:
- hist
Hist1d
- hist
See also
Examples
Create a histogram:
>>> hist = ap.Hist1d([1, 2, 3, 4, 5], [0, 1, 2, 3, 4, 5])
Only keep values within the interval [1, 4]:
>>> hist.keep(1, 4).values
[0. 2. 3. 4. 0.]
Fill removed values with a
numpy.nan>>> hist.keep(1, 4, setval=np.nan).values [nan 2. 3. 4. nan]
Squeeze length to only include kept values:
>>> hist.keep(1, 4, squeeze=True).edges
[1. 2. 3.]
>>> hist.keep(1, 4, squeeze=True).values
[2. 3]
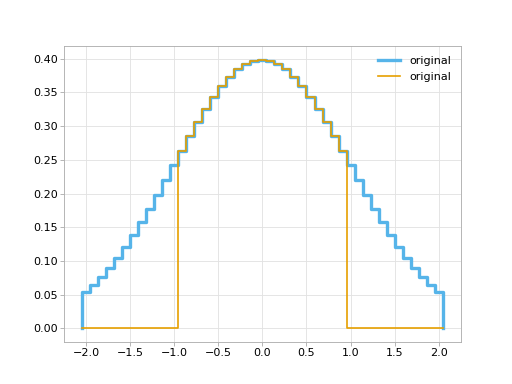
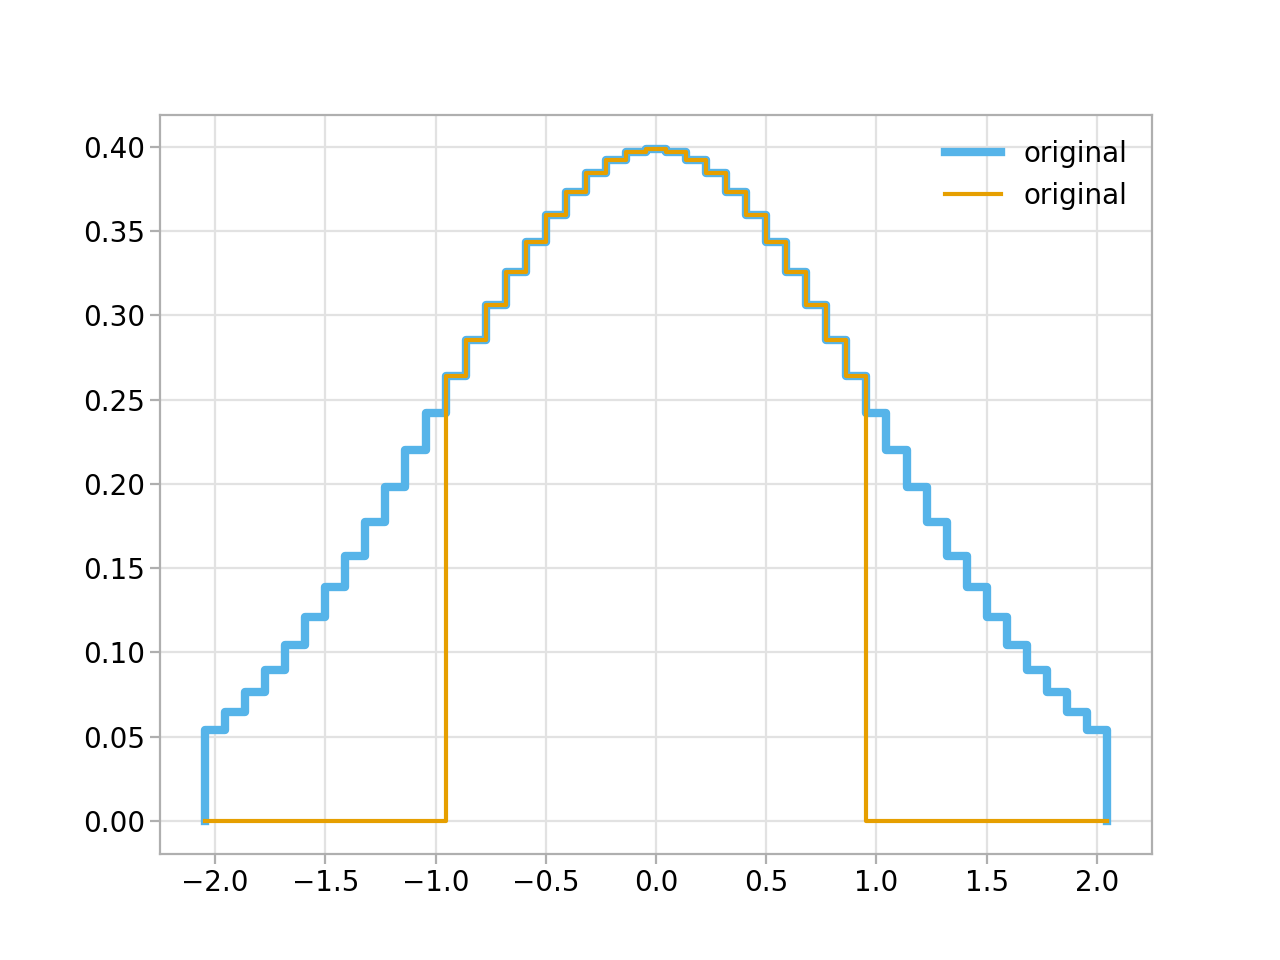
Example plot:
import matplotlib.pyplot as plt
import numpy as np

import atompy as ap

plt.style.use("atom")

# create some histogram
bin_centers = np.linspace(-2, 2, 45)
hist = ap.Hist1d.from_centers(ap.gauss(bin_centers), bin_centers)

# plot it
ax = plt.subplot()
hist.plot_step(ax, lw=3.0, label="original")
hist.keep(-1, 1).plot_step(ax, lw=1.5, label="original")
ax.legend()
(
Source code,png,hires.png,pdf)