pad_with#
- Hist1d.pad_with(value)[source]#
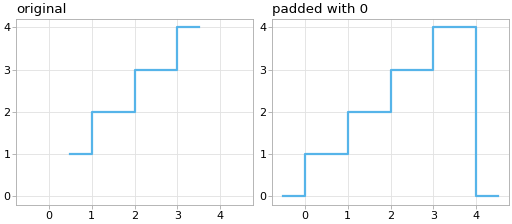
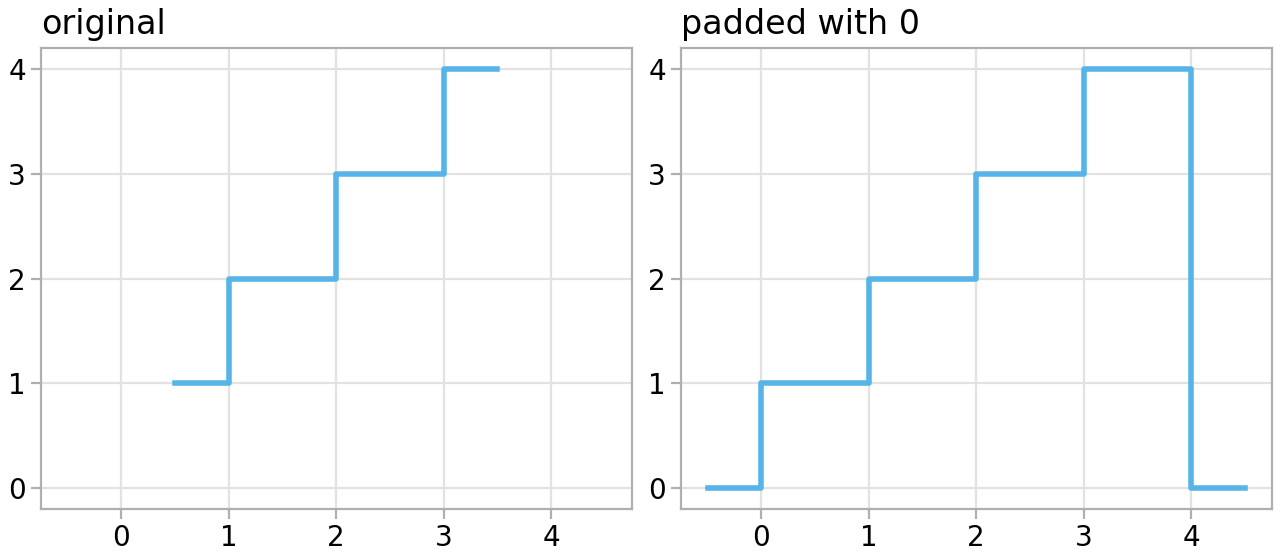
Extent histogram left and right with value.
A bin is inserted before and after the histogram. The bin has the value value.
- Parameters:
- valuefloaa
- Returns:
Hist1dA new histogram with padding.
Examples
import matplotlib.pyplot as plt
import numpy as np

import atompy as ap

plt.style.use("atom")

hist = ap.Hist1d(np.arange(4) + 1, np.arange(5))

_, axs = plt.subplots(1, 2, layout="compressed", figsize=(6.4, 2.8))

axs[0].set_title("original")
axs[0].plot(*hist.for_plot(), drawstyle="steps-mid")
axs[1].set_title("padded with 0")
axs[1].plot(*hist.pad_with(0).for_plot(), drawstyle="steps-mid")

axs[0].set_ylim(axs[1].get_ylim())
axs[0].set_xlim(axs[1].get_xlim())
(
Source code,png,hires.png,pdf)