remove#
- Hist1d.remove(lower, upper, setval=0.0)[source]#
Remove every entry of the histogram in-between lower and upper
By default, the interval is [lower, upper).
- Parameters:
- Returns:
- hist
Hist1d
- hist
See also
Examples
Create a histogram:
>>> hist = ap.Hist1d([1, 2, 3, 4, 5], [0, 1, 2, 3, 4, 5])
Only keep values in within the interval [1, 4]:
>>> hist.remove(1, 3).values
[1. 0. 0. 0. 5.]
Fill removed values with a
numpy.nan>>> hist.keep(1, 4, setval=np.nan).values [1. nan nan nan 5.]
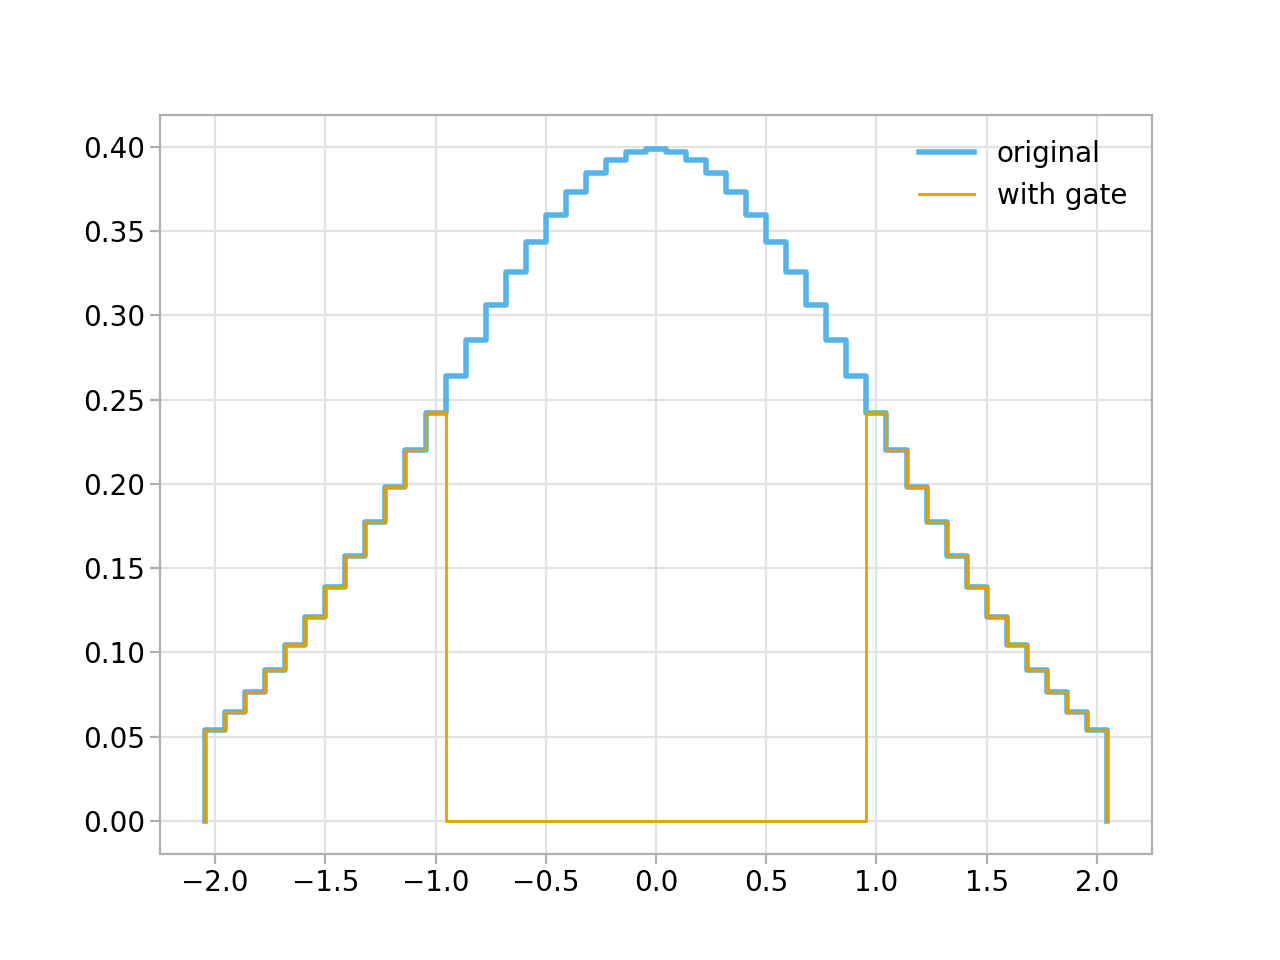
Example plot:
import matplotlib.pyplot as plt
import numpy as np

import atompy as ap

plt.style.use("atom")

# create some histogram
bin_centers = np.linspace(-2, 2, 45)
hist = ap.Hist1d.from_centers(ap.gauss(bin_centers), bin_centers)

_, ax = plt.subplots()

hist.plot_step(ax=ax, lw=2.0, label="original")
hist.remove(-1, 1).plot_step(ax=ax, lw=1.0, label="with gate")

plt.legend()
(
Source code,png,hires.png,pdf)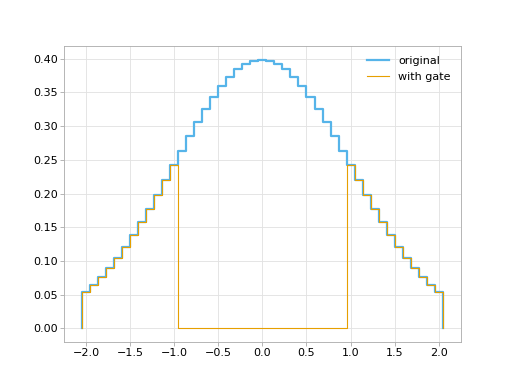