plot#
- Hist1d.plot(ax=None, fname=None, xlabel='__auto__', ylabel='__auto__', title='__auto__', logscale=False, xlim=None, ylim=None, plot_fmt=None, savefig_kwargs={}, use_fixed_layout=None, fixed_layout_kwargs=None, make_me_nice=None, make_me_nice_kwargs=None, **plot_kwargs)[source]#
Plot the 1D histogram using
matplotlib.pyplot.plot.- Parameters:
- fname
str, optional If provided, the plot will be saved to this file using
matplotlib.figure.Figure.savefig().- xlabel
str, default “__auto__” Label for the x-axis.
If “__auto__”, use Hist1d.xlabel.
- ylabel
str, default “__auto__” Label for the y-axis.
If “__auto__”, use Hist1d.ylabel.
- title
str, default “__auto__” Title of the plot.
If “__auto__”, use Hist1d.title.
- logscalebool, optional
If True, use a logarithmic y scale.
- xlim
tuple[float|None,float|None], optional Limits for the x-axis.
- ylim
tuple[float|None,float|None], optional Limits for the y-axis.
- plot_fmt
str, optional format string for
matplotlib.pyplot.plot.- savefig_kwargs
dict, optional Additional keyword arguments passed to
savefig().
- fname
- Returns:
tupleofmatplotlib.figure.Figure,matplotlib.axes.AxesA tuple containing the matplotlib Figure and Axes.
- Other Parameters:
- plot_kwargs
dict, optional Additional keyword arguments passed to
matplotlib.pyplot.plot.- use_fixed_layout
Deprecated since version 5.5.0: Does nothing.
- fixed_layout_kwargs
Deprecated since version 5.5.0: Does nothing.
- make_me_nice
Deprecated since version 5.5.0: Does nothing.
- make_me_nice_kwargs
Deprecated since version 5.5.0: Does nothing.
- plot_kwargs
Examples
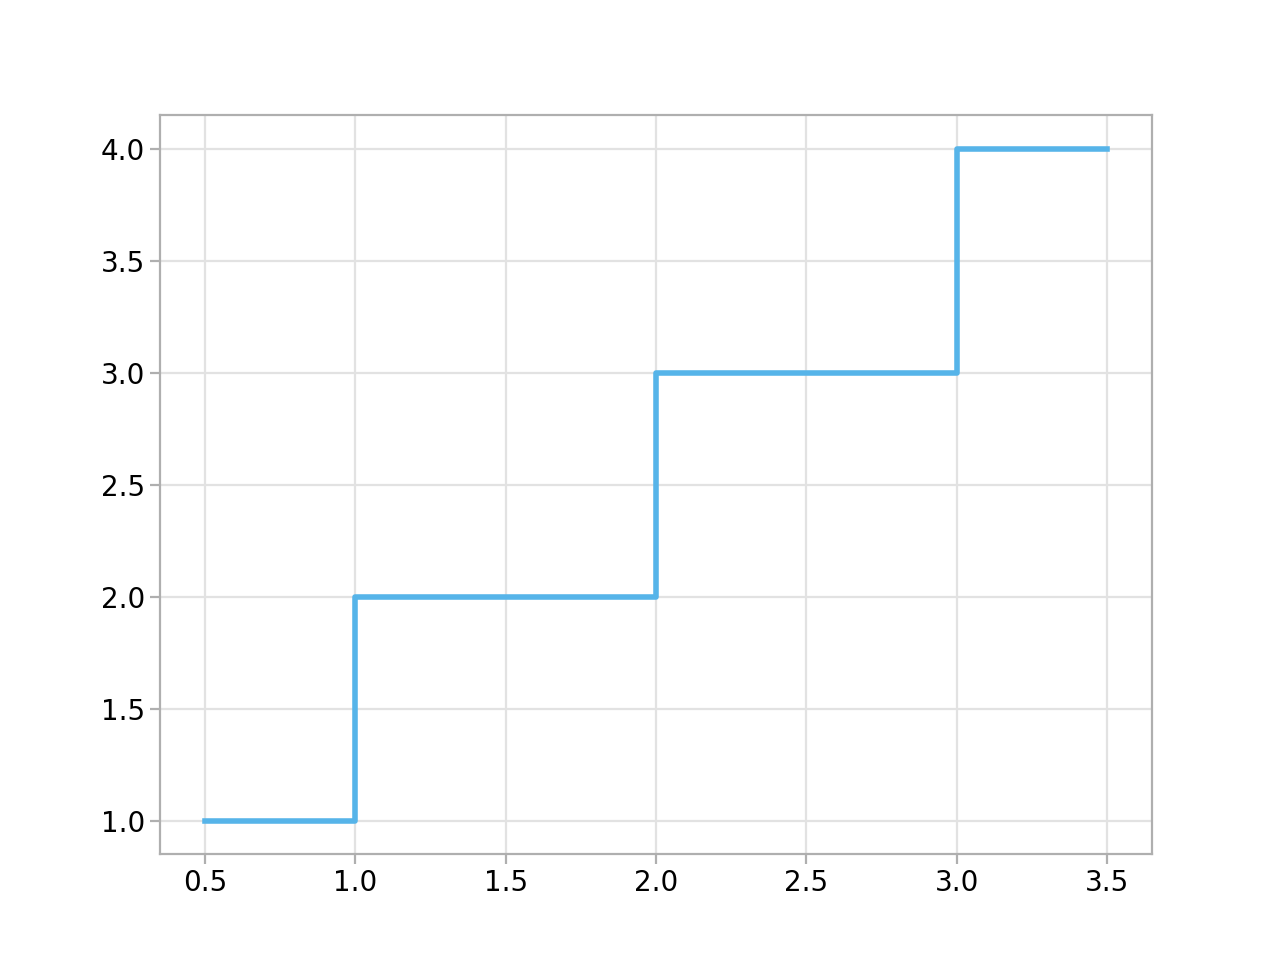
import matplotlib.pyplot as plt

import atompy as ap

plt.style.use("atom")

hist = ap.Hist1d((1, 2, 3, 4), (0, 1, 2, 3, 4))
hist.plot(drawstyle="steps-mid")
(
Source code,png,hires.png,pdf)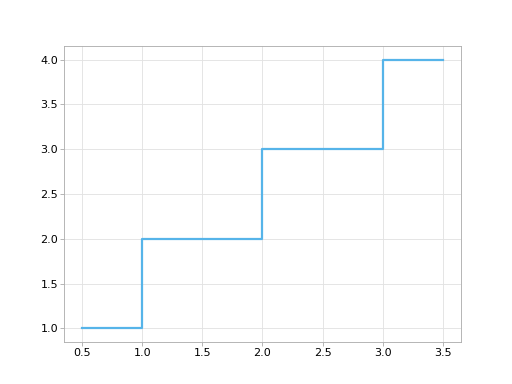
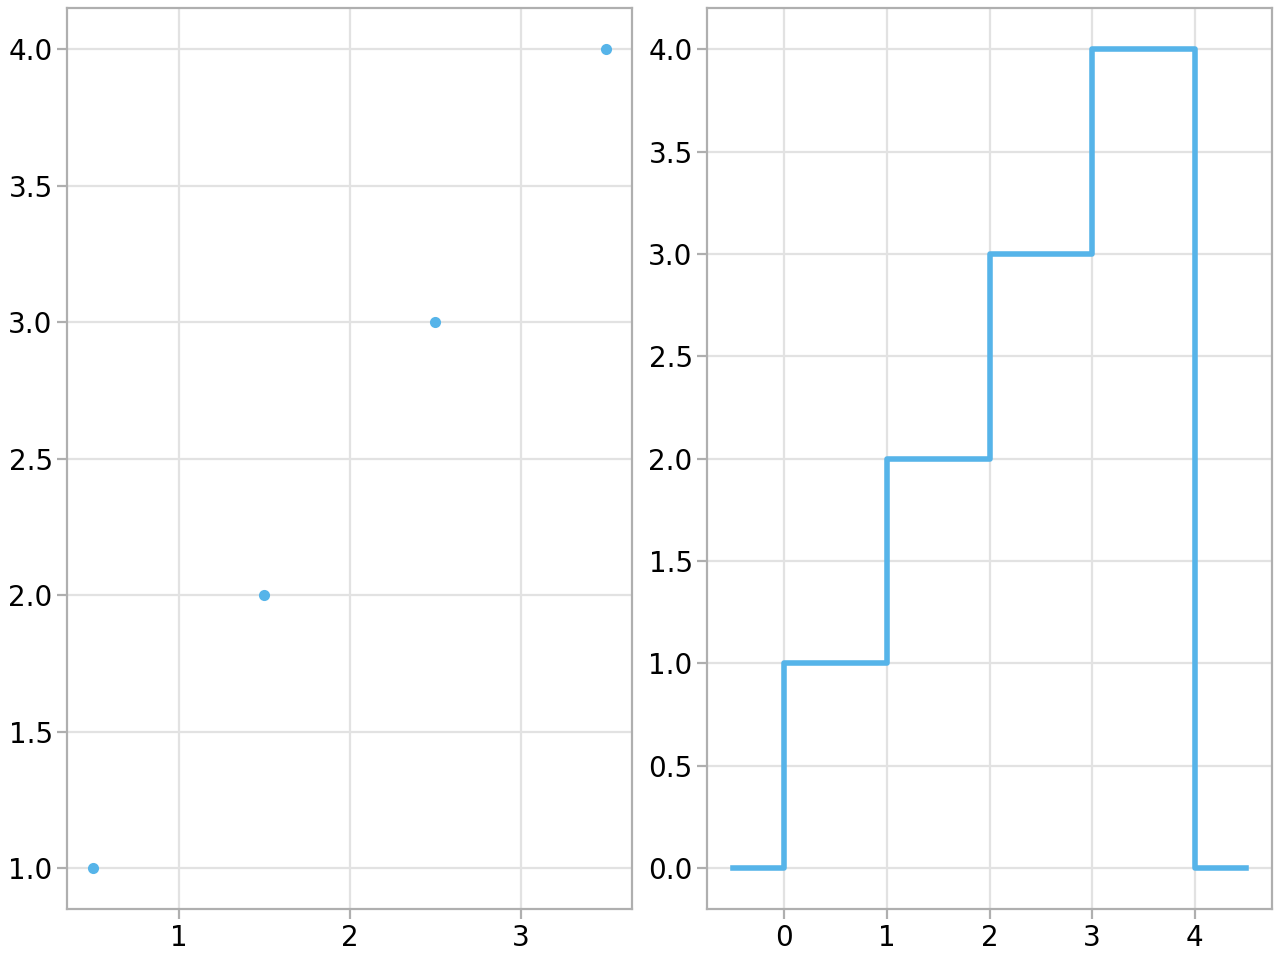
import matplotlib.pyplot as plt

import atompy as ap

plt.style.use("atom")

hist = ap.Hist1d((1, 2, 3, 4), (0, 1, 2, 3, 4))

_, axs = plt.subplots(1, 2, layout="compressed")

hist.plot(axs[0], plot_fmt="o")
hist.pad_with(0).plot(axs[1], drawstyle="steps-mid")
plt.show()
(
Source code,png,hires.png,pdf)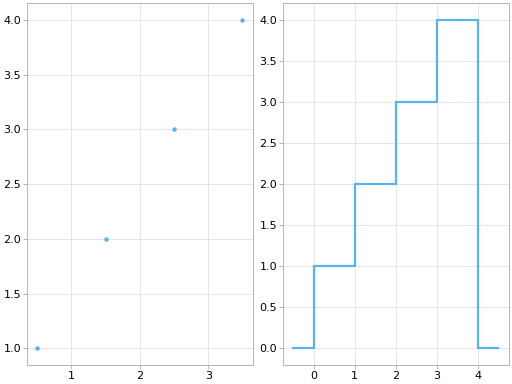