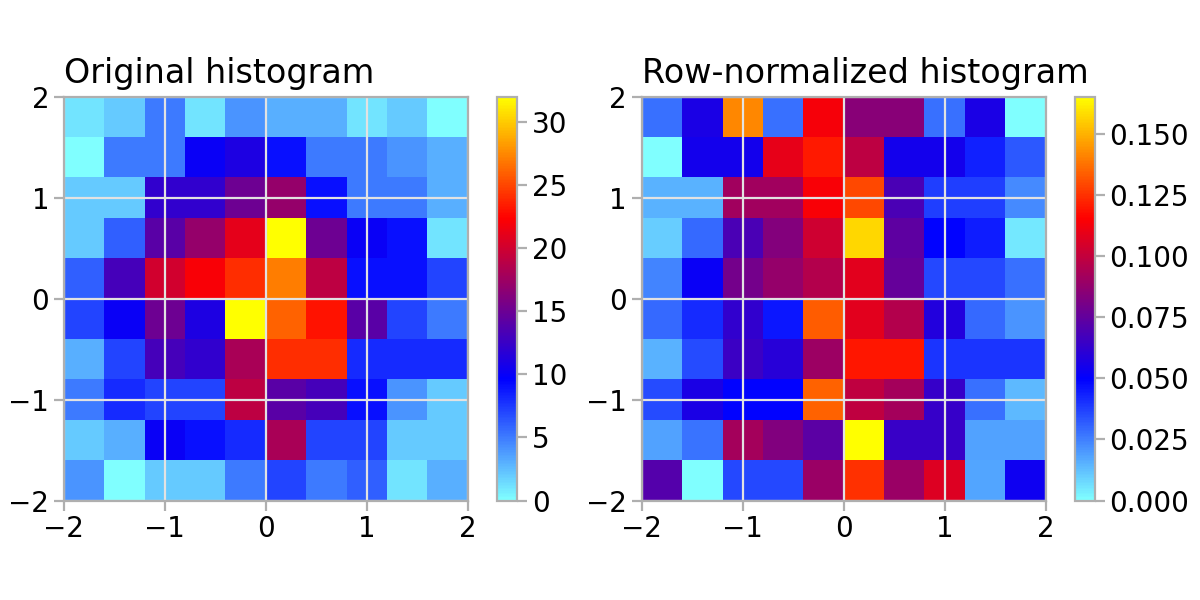
norm_row_to_integral#
- Hist2d.norm_row_to_integral()[source]#
Normalize each row to their integral.
- Returns:
- new_hist2d
Hist2d A new histogram where the rows are normalized.
- new_hist2d
Examples
import matplotlib.pyplot as plt
import numpy as np

import atompy as ap

plt.style.use("atom")

rng = np.random.default_rng(42)
lim = (-2, 2)
size = 1_000

hist = ap.Hist2d(*np.histogram2d(*rng.normal(size=(2, size)), range=(lim, lim)))

_, axs = plt.subplots(1, 2, layout="compressed", figsize=(6.0, 3.0))
for ax in axs:
    ax.set_box_aspect(1)

hist.plot(ax=axs[0], title="Original histogram")
hist.norm_row_to_integral().plot(ax=axs[1], title="Row-normalized histogram")
(
Source code,png,hires.png,pdf)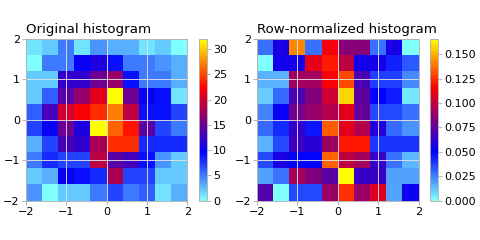