plot#
- Hist2d.plot(ax=None, fname=None, xlabel='__auto__', ylabel='__auto__', zlabel='__auto__', title='__auto__', logscale=False, xlim=None, ylim=None, colorbar_kwargs={}, savefig_kwargs={}, use_fixed_layout=None, fixed_layout_kwargs=None, make_me_nice=None, make_me_nice_kwargs=None, **pcolormesh_kwargs)[source]#
Plot the 2D histogram using
matplotlib.pyplot.pcolormesh.- Parameters:
- fname
str, optional If provided, the plot will be saved to this file.
- xlabel
str, default “__auto__” Label for the x-axis.
If “__auto__”, use Hist2d.xlabel.
- ylabel
str, default “__auto__” Label for the y-axis.
If “__auto__”, use Hist2d.ylabel.
- zlabel
str, default “__auto__” Label for the colorbar (z-axis).
If “__auto__”, use Hist2d.zlabel.
- title
str, default “__auto__” Title of the plot.
If “__auto__”, use Hist2d.title.
- logscalebool, optional
If True, use a logarithmic color scale.
- xlim
tuple[float,float], optional Limits for the x-axis.
- ylim
tuple[float,float], optional Limits for the y-axis.
- colorbar_kwargs: dict, optional
Additional keyword arguments passed to
add_colorbar().- savefig_kwargs
dict, optional Additional keyword arguments passed to
savefig().
- fname
- Returns:
tupleof Figure, Axes, ColorbarA tuple containing the matplotlib Figure, Axes, and Colorbar objects.
- Other Parameters:
- pcolormesh_kwargs
dict, optional Additional keyword arguments passed to
pcolormesh.- use_fixed_layout
Deprecated since version 5.5.0: Does nothing.
- fixed_layout_kwargs
Deprecated since version 5.5.0: Does nothing.
- make_me_nice
Deprecated since version 5.5.0: Does nothing.
- make_me_nice_kwargs
Deprecated since version 5.5.0: Does nothing.
- pcolormesh_kwargs
Examples
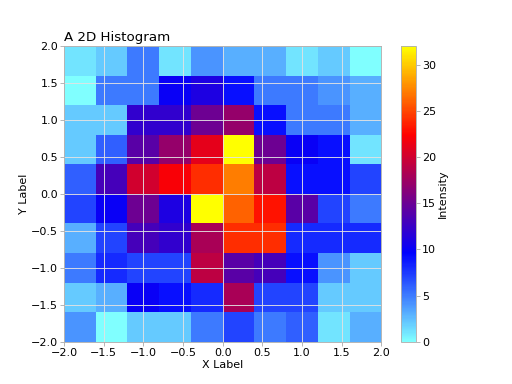
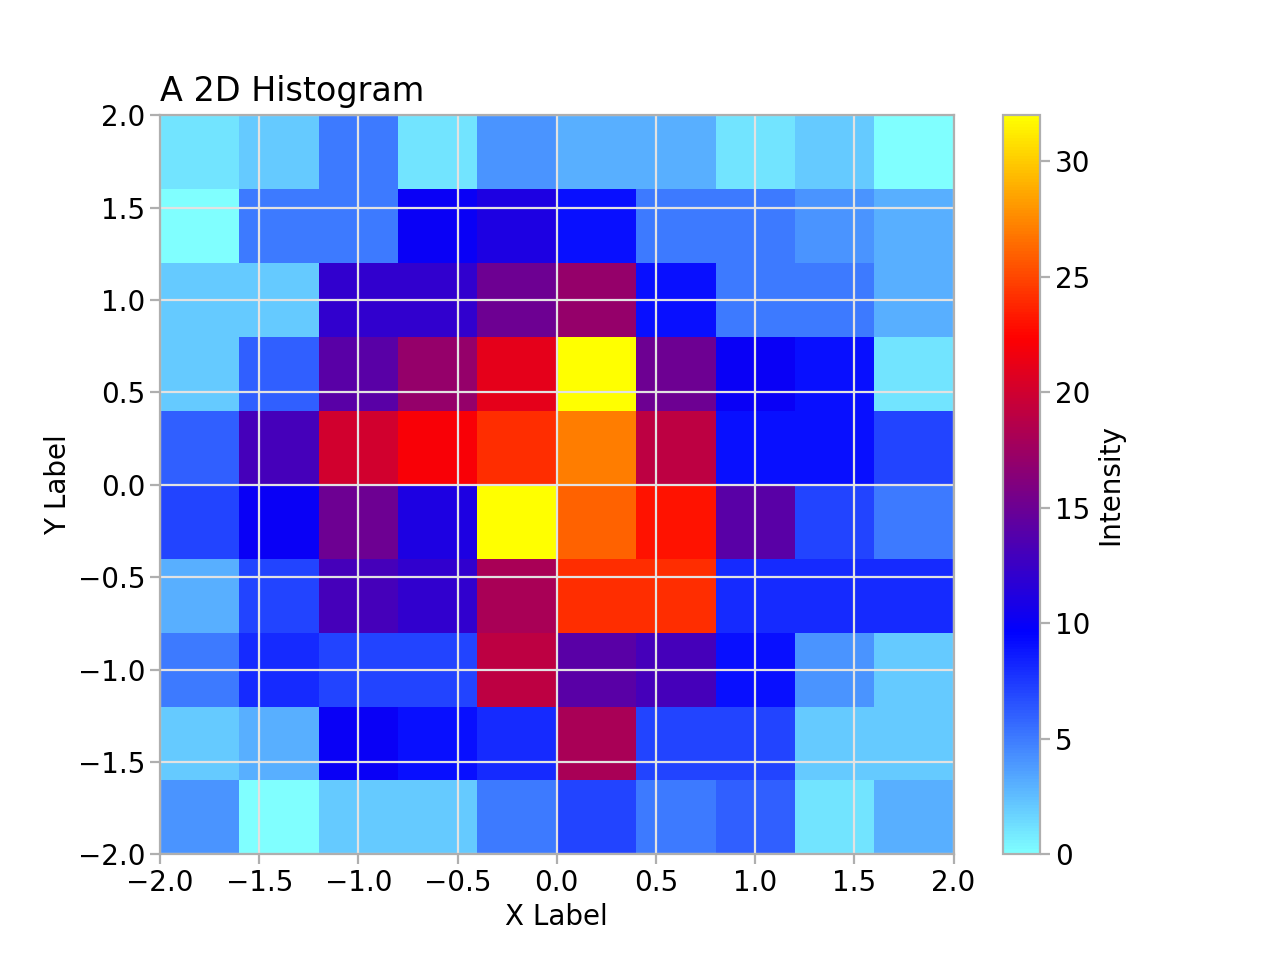
import matplotlib.pyplot as plt
import numpy as np

import atompy as ap

plt.style.use("atom")

rng = np.random.default_rng(42)
lim = (-2, 2)
size = 1_000

hist = ap.Hist2d(
    *np.histogram2d(*rng.normal(size=(2, size)), range=(lim, lim)),
    title="A 2D Histogram",
    xlabel="X Label",
    ylabel="Y Label",
    zlabel="Intensity",
)

fig, ax, cb = hist.plot()

plt.show()
(
Source code,png,hires.png,pdf)
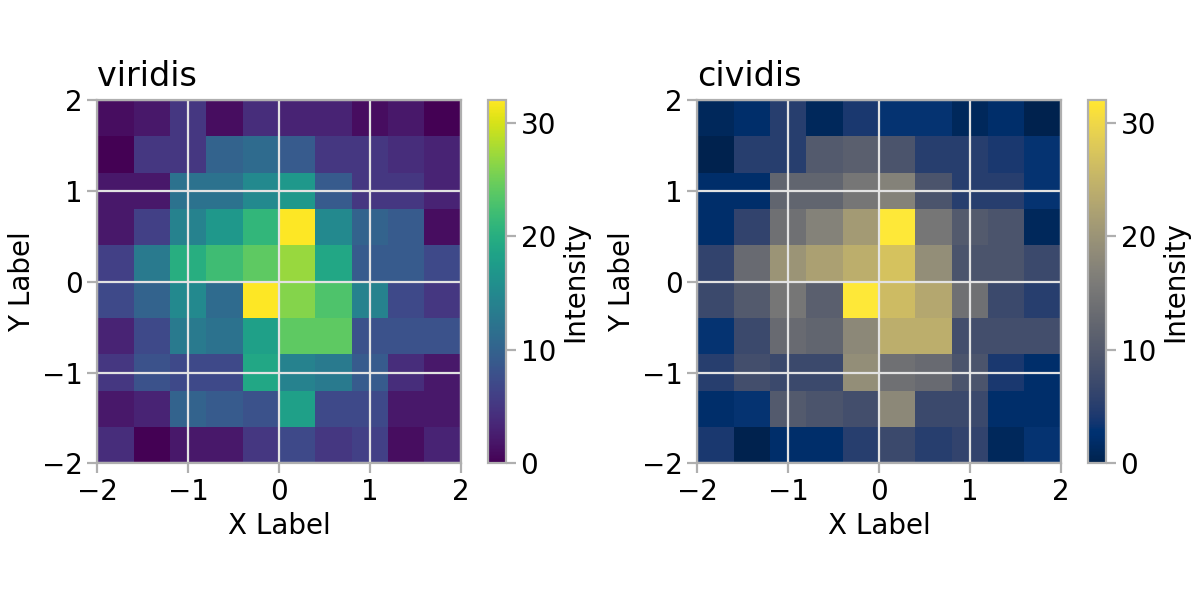
import matplotlib.pyplot as plt
import numpy as np

import atompy as ap

plt.style.use("atom")

rng = np.random.default_rng(42)
lim = (-2, 2)
size = 1_000

hist = ap.Hist2d(
    *np.histogram2d(*rng.normal(size=(2, size)), range=(lim, lim)),
    xlabel="X Label",
    ylabel="Y Label",
    zlabel="Intensity",
)

fig, axs = plt.subplots(ncols=2, layout="compressed", figsize=(6.0, 3.0))

cmaps = "viridis", "cividis"

for ax, cmap in zip(axs, cmaps):
    ax.set_box_aspect(1)
    hist.plot(ax=ax, title=cmap, cmap=cmap)
(
Source code,png,hires.png,pdf)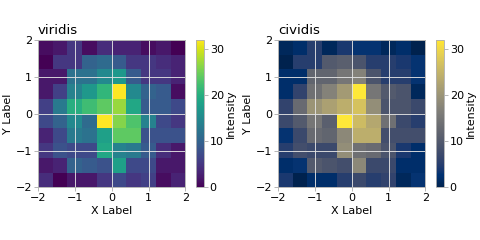