norm_to_xbins#
- Hist2d.norm_to_xbins()[source]#
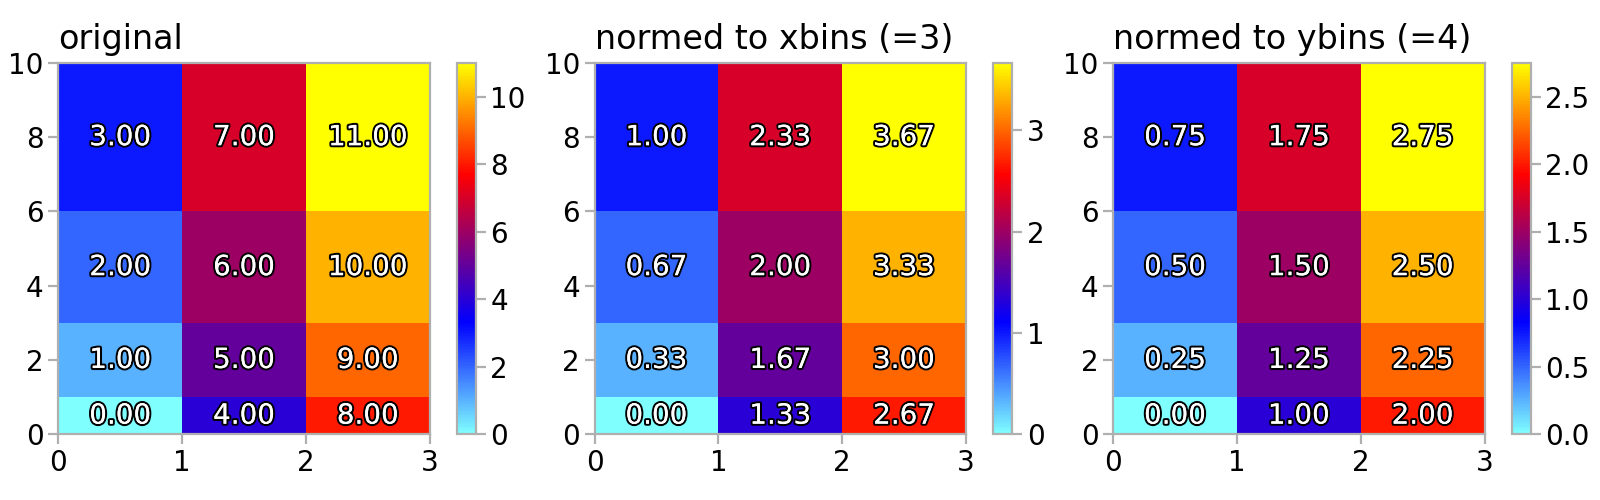
Normalize values to the number of x bins.
- Returns:
- new_hist2d
Hist2d A new histogram where all values are divided by the number of x bins.
- new_hist2d
See also
Examples
import matplotlib.patheffects as patheffects
import matplotlib.pyplot as plt
import numpy as np

import atompy as ap

plt.style.use("atom")
plt.rcParams["axes.grid"] = False

xedges = np.array([0, 1, 2, 3])
yedges = np.array([0, 1, 3, 6, 10])
values = np.array(
    [
        [0, 1, 2, 3],
        [4, 5, 6, 7],
        [8, 9, 10, 11],
    ]
)
hist = ap.Hist2d(values, xedges, yedges)
hists = (hist, hist.norm_to_xbins(), hist.norm_to_ybins())

_, axs = plt.subplots(1, len(hists), layout="compressed", figsize=(8.0, 2.5))

titles = (
    "original",
    f"normed to xbins (={hist.xbins})",
    f"normed to ybins (={hist.ybins})",
)

for i, ax in enumerate(axs):
    ax.set_box_aspect(1)
    hists[i].plot(ax=ax, title=titles[i])

    # show values of bin in plot
    for j, x in enumerate(hists[i].xcenters):
        for k, y in enumerate(hists[i].ycenters):
            text = ax.text(
                x, y, f"{hists[i].values[j, k]:.2f}", va="center", ha="center", c="w"
            )
            text.set_path_effects(
                [
                    patheffects.withStroke(linewidth=1.5, foreground="k"),
                    patheffects.Normal(),
                ]
            )
(
Source code,png,hires.png,pdf)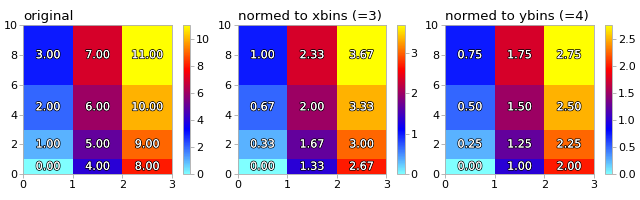