remove_zeros#
- Hist2d.remove_zeros()[source]#
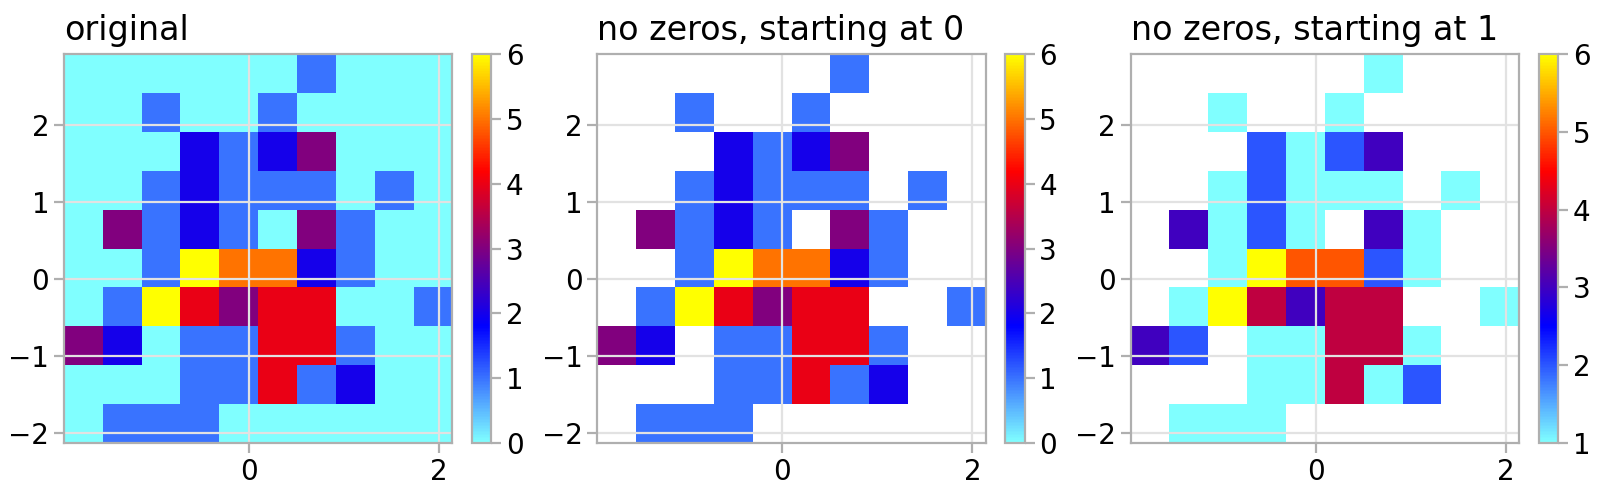
Replace zeros with NaN, removing them from colormaps.
Examples
import matplotlib.pyplot as plt
import numpy as np

import atompy as ap

plt.style.use("atom")

gen = np.random.default_rng(42)
hist = ap.Hist2d(*np.histogram2d(*gen.normal(size=(2, 100))))

_, axs = plt.subplot_mosaic([["a", "b", "c"]], layout="compressed", figsize=(8.0, 2.5))
for ax in axs.values():
    ax.set_box_aspect(1)

hist.plot(ax=axs["a"], title="original")
hist.remove_zeros().plot(ax=axs["b"], vmin=0, title="no zeros, starting at 0")
hist.remove_zeros().plot(ax=axs["c"], title="no zeros, starting at 1")
(
Source code,png,hires.png,pdf)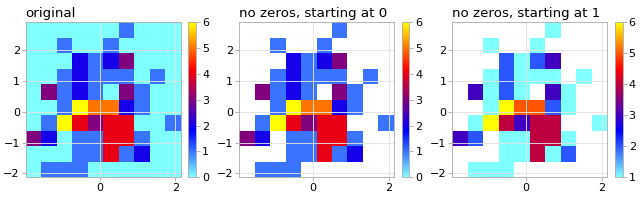