project_onto_y#
- Hist2d.project_onto_y()[source]#
Project histogram onto its x-axis.
Note
If you want to only want to project within some x/y gate, use
Hist2d.keep()orHist2d.remove().- Returns:
- hist1d
Hist1d A 1D histogram where the bins are the x-bins of the original 2D histogram, and the bin-values are the projection.
- hist1d
Examples
import matplotlib.pyplot as plt
import numpy as np

import atompy as ap

plt.style.use("atom")

rng = np.random.default_rng(42)
lim = (-2, 2)
size = 1_000

hist = ap.Hist2d(
    *np.histogram2d(
        rng.normal(-0.5, size=size),
        rng.normal(0.5, size=size),
        range=(lim, lim),
    ),
    xlabel="x",
    ylabel="y",
    zlabel="intensity",
)

_, axs = plt.subplots(2, 2, squeeze=False, layout="compressed")
axs = axs.flat

hist.plot(ax=axs[0])

hist.project_onto_y().plot_step(axs[1], title="project all")
hist.keep(ylower=-1, yupper=1, squeeze=False).project_onto_y().plot_step(
    axs[2], title="project within y gate"
)
hist.remove(ylower=-1, yupper=1).project_onto_y().plot_step(
    axs[3], title="project outside y gate"
)

for ax in axs[1:]:
    ax.set_ylim(axs[1].get_ylim())

for ax in axs:
    ax.set_box_aspect(1)

plt.show()
(
Source code,png,hires.png,pdf)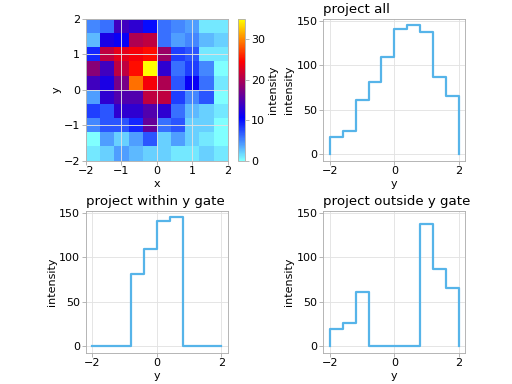