from_image#
- classmethod Hist2d.from_image(image, extents=((0, 1), (0, 1)), title='', xlabel='', ylabel='', zlabel='', origin='upper')[source]#
Create a
Hist2dfrom a 2D image.This method converts a 2D array of pixel intensities into a histogram-like representation, where each pixel corresponds to a bin and the provided
extentsdefine the coordinate range of the image.- Parameters:
- imagearray_like of shape (M, N)
The input 2D image data. Each element represents the value of a bin. The first dimension corresponds to the vertical axis and the second to the horizontal axis. Internally, the image is transposed so that the x-axis corresponds to the first histogram dimension and the y-axis to the second.
- extentsarray_like of shape ((xmin, xmax), (ymin, ymax)), default ((0, 1), (0, 1))
The coordinate limits of the image in data units. These define the bin edges along the x and y axes.
- title
str, default “” The title of the histogram.
- xlabel
str, default “” Label for the x-axis.
- ylabel
str, default “” Label for the y-axis.
- zlabel
str, default “” Label for the bin values (e.g., intensity or counts).
- origin{“upper”, “lower”}, default “upper”
Placement of the [0, 0] index of the image. If “upper”, the first row of the image is treated as the top and the image is flipped vertically to match a Cartesian coordinate system. If “lower”, the first row is treated as the bottom. Default is “upper”.
- Returns:
- Self
A new
Hist1dinstance representing the image as a 2D histogram, with bin edges derived fromextentsand bin contents fromimage.
Examples
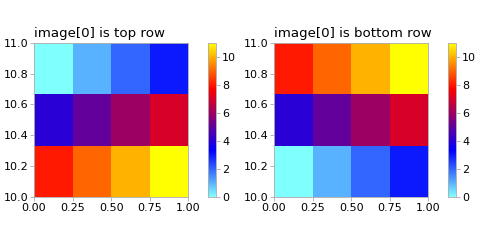
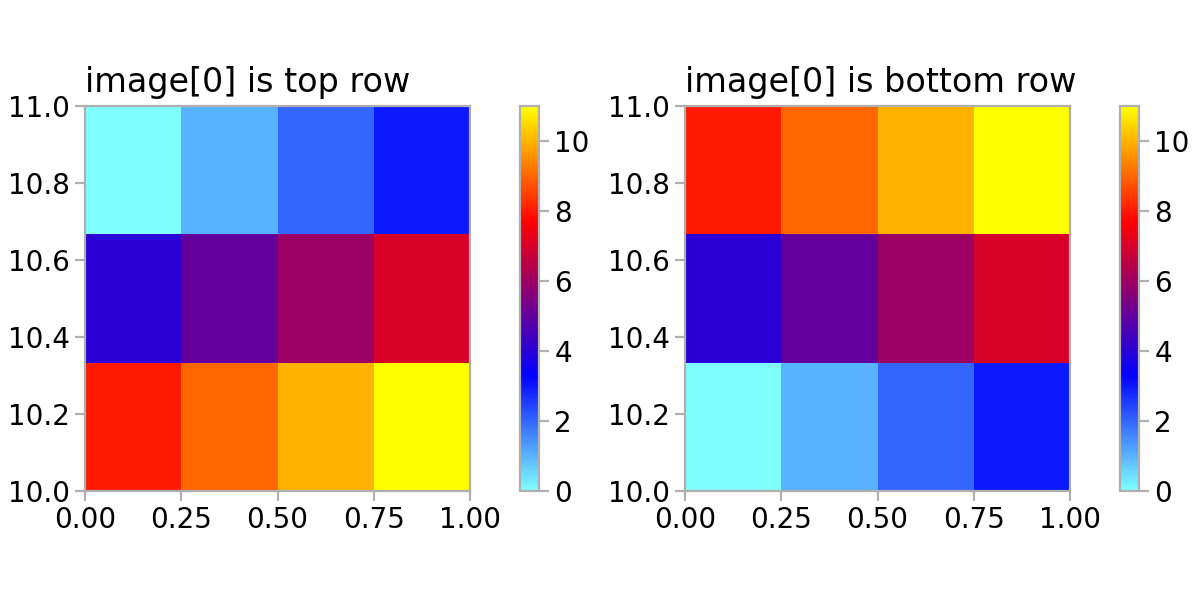
import matplotlib.pyplot as plt

import atompy as ap

image = (
    (0, 1, 2, 3),
    (4, 5, 6, 7),
    (8, 9, 10, 11),
)
extents = ((0, 1), (10, 11))

hist0 = ap.Hist2d.from_image(image, extents, title="image[0] is top row")
hist1 = ap.Hist2d.from_image(
    image, extents, origin="lower", title="image[0] is bottom row"
)

plt.style.use("atom")
plt.rcParams["axes.grid"] = False
_, axs = plt.subplots(1, 2, layout="compressed", figsize=(6.0, 3.0))
for ax, hist in zip(axs, (hist0, hist1)):
    hist.plot(ax)
    ax.set_box_aspect(1)
(
Source code,png,hires.png,pdf)